Key takeaways
- In metabolic acidosis, Winters’ formula predicts expected pCO2 = (1.5 × HCO3−) + 8 (± 2) mmHg; a measured pCO2 above this range indicates coexisting respiratory acidosis, below it indicates coexisting respiratory alkalosis.
- The neonatal anion gap reference range in critically ill newborns is 4–12 mEq/L (8 ± 4); an AG above 16 in metabolic acidosis suggests lactic acidosis, while values between 8 and 16 do not differentiate causes.
- In respiratory acidosis, expected HCO3− rise is about +1 mEq/L per 10 mmHg pCO2 increase acutely, versus ≈+4 (3.5–5) mEq/L per 10 mmHg when chronic (>2–5 days).
- Sodium bicarbonate is not for routine use and is no longer recommended in CPR; when needed, the deficit is calculated as HCO3− (mEq) = base deficit × weight (kg) × 0.3, infused slowly over 30–60 minutes.
- Oxygenation severity can be graded using the Oxygenation Index (OI >15 severe, >25 consider ECMO, ≥40 historically ~80% mortality) or its non-invasive counterpart OSI, where OI ≈ 2 × OSI when preductal SpO2 is 70–99%.
References
- Travers C, Ambalavanan N. Blood gases: technical aspects and interpretation. In: Keszler M, Gautham KS, eds. Goldsmith’s Assisted Ventilation of the Neonate. 7th ed. Elsevier; 2022. Ch. 10, p. 94–110.
- Mathew B, Lakshminrusimha S. Noninvasive monitoring of gas exchange. In: Goldsmith’s Assisted Ventilation of the Neonate. 7th ed. Elsevier; 2022. Ch. 11.
- Albert MS, Dell RB, Winters RW. Quantitative displacement of acid-base equilibrium in metabolic acidosis. Ann Intern Med. 1967;66:312-22.
- Adrogué HJ, Madias NE. Secondary responses to altered acid-base status: the rules of engagement. J Am Soc Nephrol. 2010;21:920-3.
- Berend K, de Vries AP, Gans RO. Physiological approach to assessment of acid-base disturbances. N Engl J Med. 2014;371:1434-45.
- Lorenz JM, Kleinman LI, Markarian K, et al. Serum anion gap in the differential diagnosis of metabolic acidosis in critically ill newborns. J Pediatr. 1999;135:751-5.
- Kraut JA, Madias NE. Serum anion gap: its uses and limitations in clinical medicine. Clin J Am Soc Nephrol. 2007;2:162-74.
- The Harriet Lane Handbook. 23rd ed. Elsevier; 2023. Table 11.14.
- Kliegman RM, St Geme JW III, Blum NJ, et al. Nelson Textbook of Pediatrics. 22nd ed. Elsevier; 2025.
- Mammel MC, van Kaam AHLC, Donn SM, eds. Manual of Neonatal Respiratory Care. 5th ed. Springer; 2022.
- Kraut JA, Madias NE. Serum anion gap: its uses and limitations in clinical medicine. Clin J Am Soc Nephrol 2007;2:162-74.
- Lorenz JM, Kleinman LI, Markarian K, Oliver M, Fernandez J. Serum anion gap in the differential diagnosis of metabolic acidosis in critically ill newborns. J Pediatr 1999;135:751-5.
- Winters’ formula: Albert MS, Dell RB, Winters RW. Quantitative displacement of acid-base equilibrium in metabolic acidosis. Ann Intern Med 1967;66:312-22.
- Respiratory acidosis: Adrogué HJ, Madias NE. Secondary responses to altered acid-base status: the rules of engagement. J Am Soc Nephrol 2010;21:920-3.
- Respiratory acidosis: The Harriet Lane Handbook. 23rd ed. Elsevier; 2023. Table 11.14.
- Respiratory acidosis: Berend K, de Vries AP, Gans RO. Physiological approach to assessment of acid-base disturbances. N Engl J Med 2014;371:1434-45. Table 1.
- Elias Knobel, Adalberto Stape, Eduardo Juan Troster, Alice D’Agostini Deutsch – Terapia Intensiva: Pediatria e Neonatologia – Atheneu, p. 851 e 853 — formula and normal range.
- Ashok P. Sarnaik, Shekhar T. Venkataraman, Bradley A. Kuch – Mechanical Ventilation in Neonates and Children: A Pathophysiology-Based Management Approach – Springer (2022), p. 26 — formula.
- Nelson Textbook of Pediatrics – 22nd Edition – Elsevier, p. 616 — formula e definição PARDS 2.0.
- Keszler (editor), K. Suresh Gautham (editor) – Smith’s Assisted Ventilation of the Neonate – 7th Edition – Elsevier (2022), p. 116 — relação com o Índice de Oxigenação.
- Martin Keszler (editor), K. Suresh Gautham (editor) – Goldsmith’s Assisted Ventilation of the Neonate – 7th Edition – Elsevier (2022), p. 26 e 581 — alveolar gas equation; p. 355 (Box 28.1) — ECMO criterion.
- Ashok P. Sarnaik, Shekhar T. Venkataraman, Bradley A. Kuch – Mechanical Ventilation in Neonates and Children: A Pathophysiology-Based Management Approach – Springer (2022), p. 57 — normal range
Bedside Guide · Neonatology
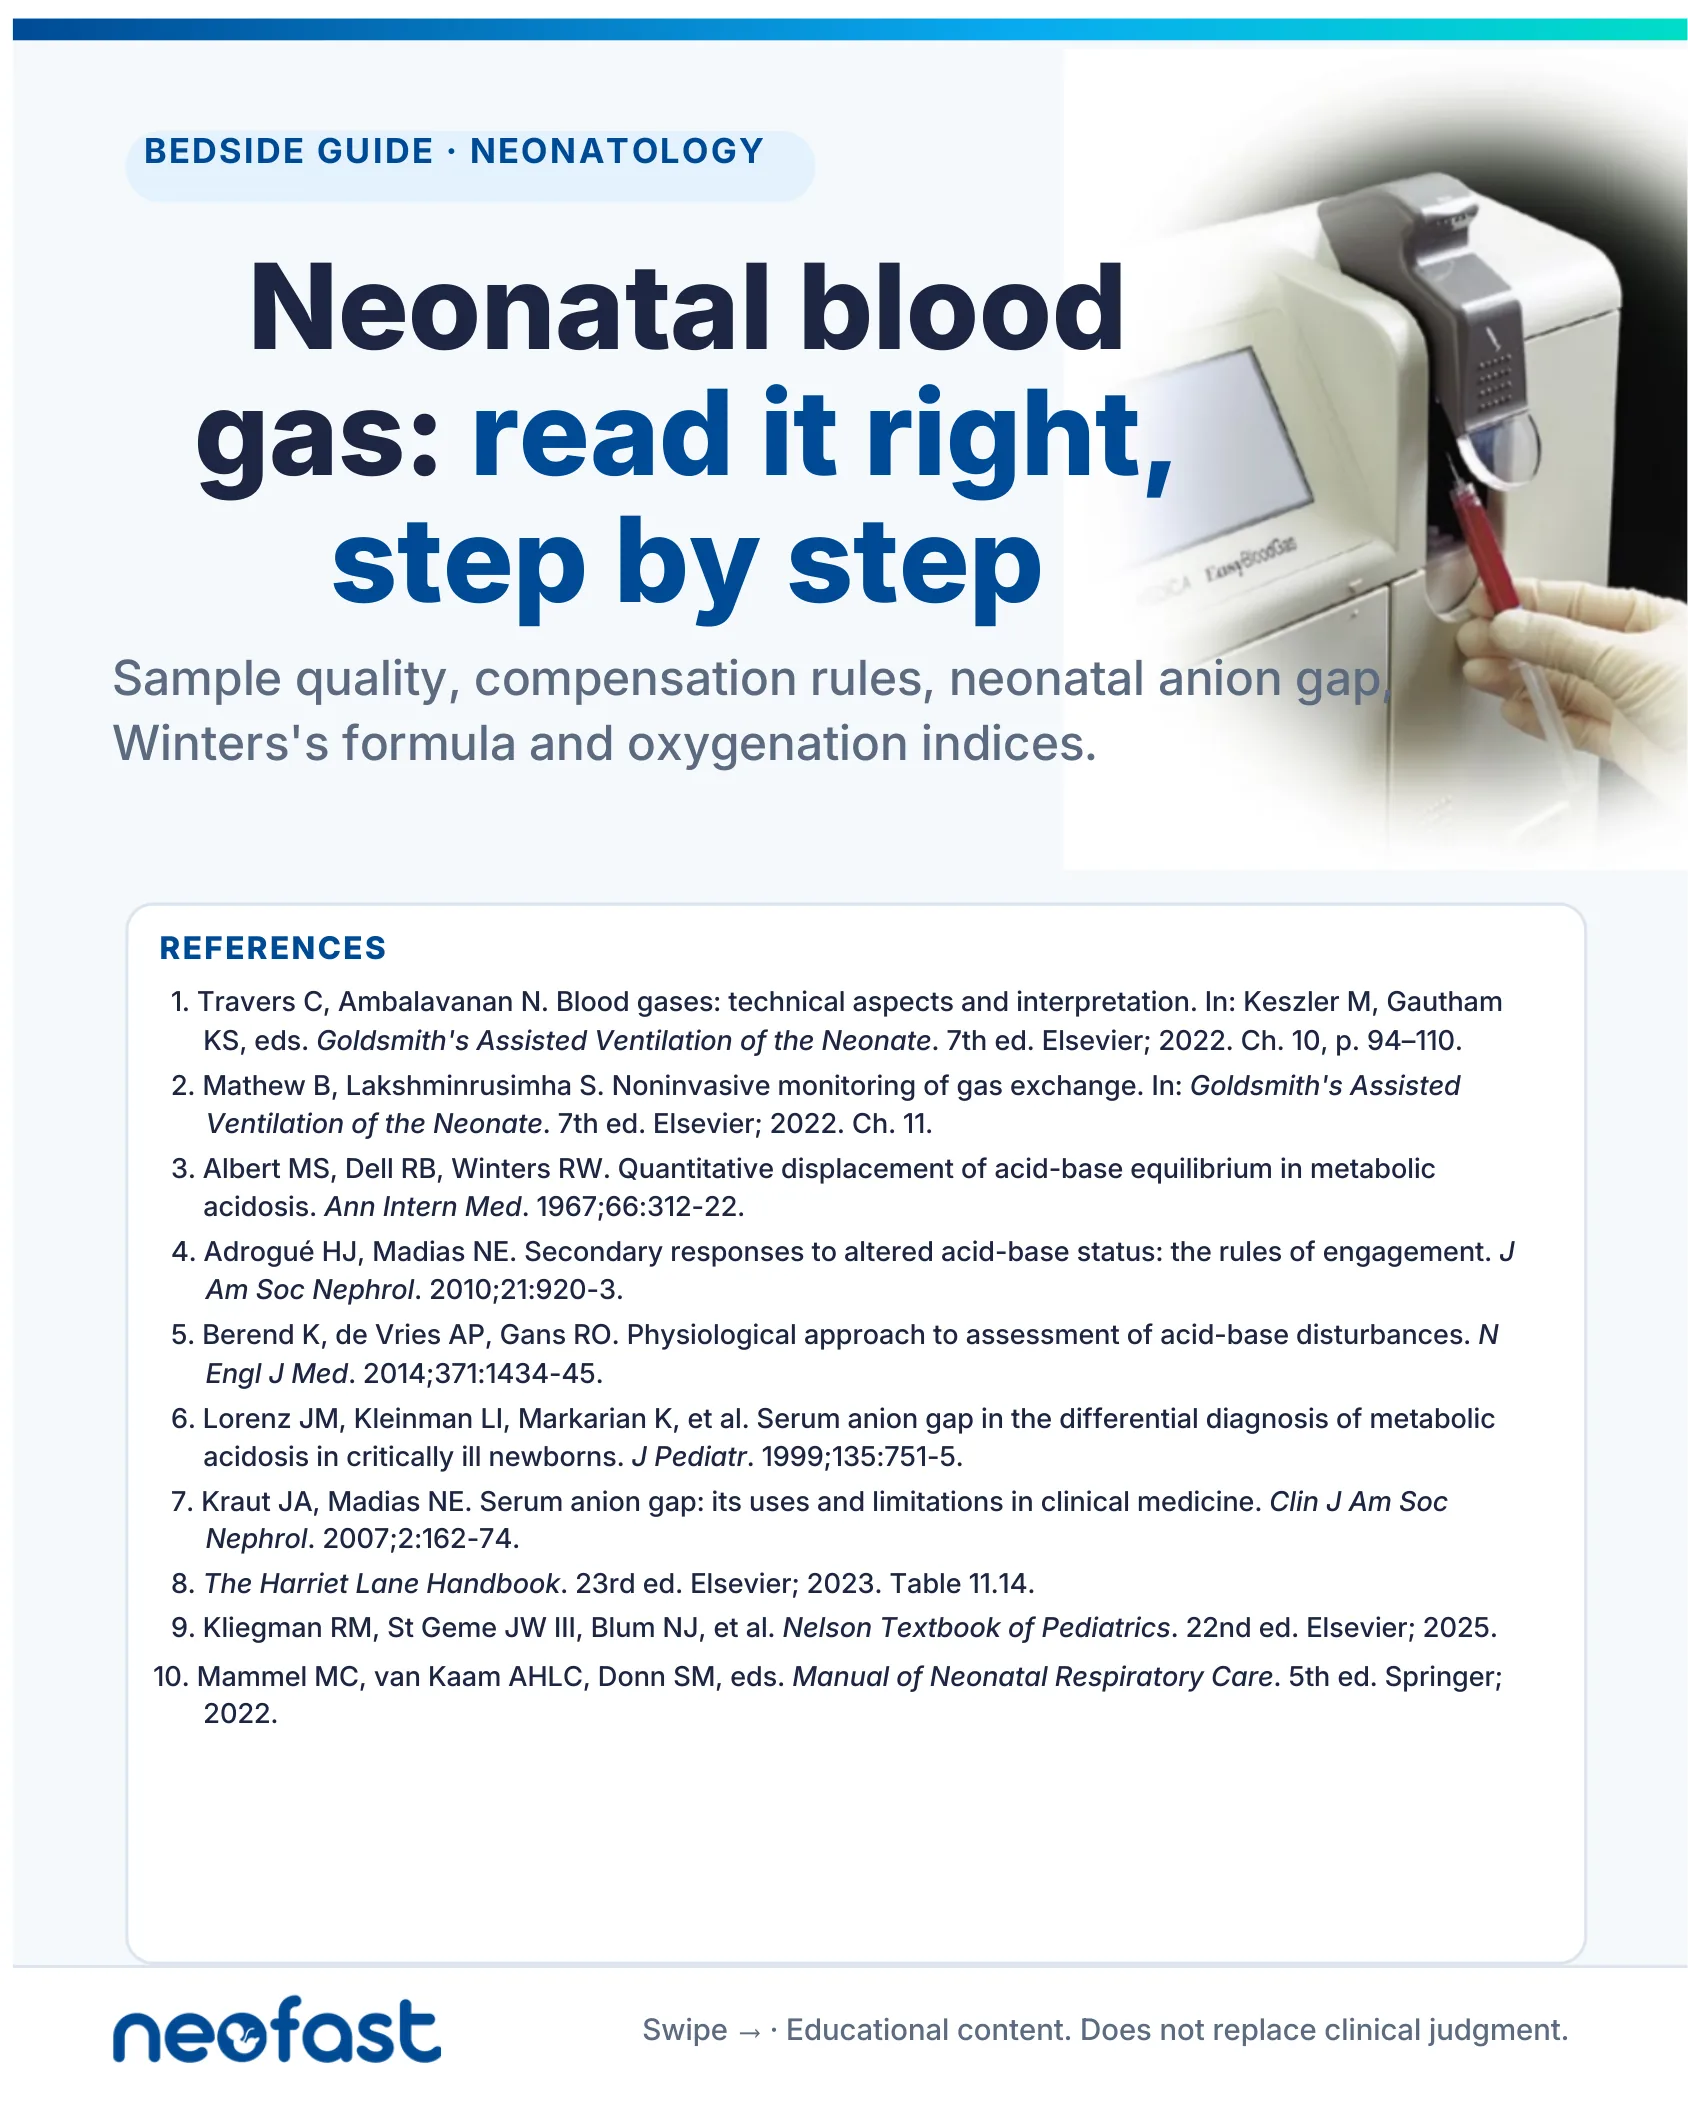
Neonatal blood gas: read it right, step by step
Sample quality, compensation rules, neonatal anion gap, Winters’s formula and oxygenation indices.
The Workflow · Six steps, every gas
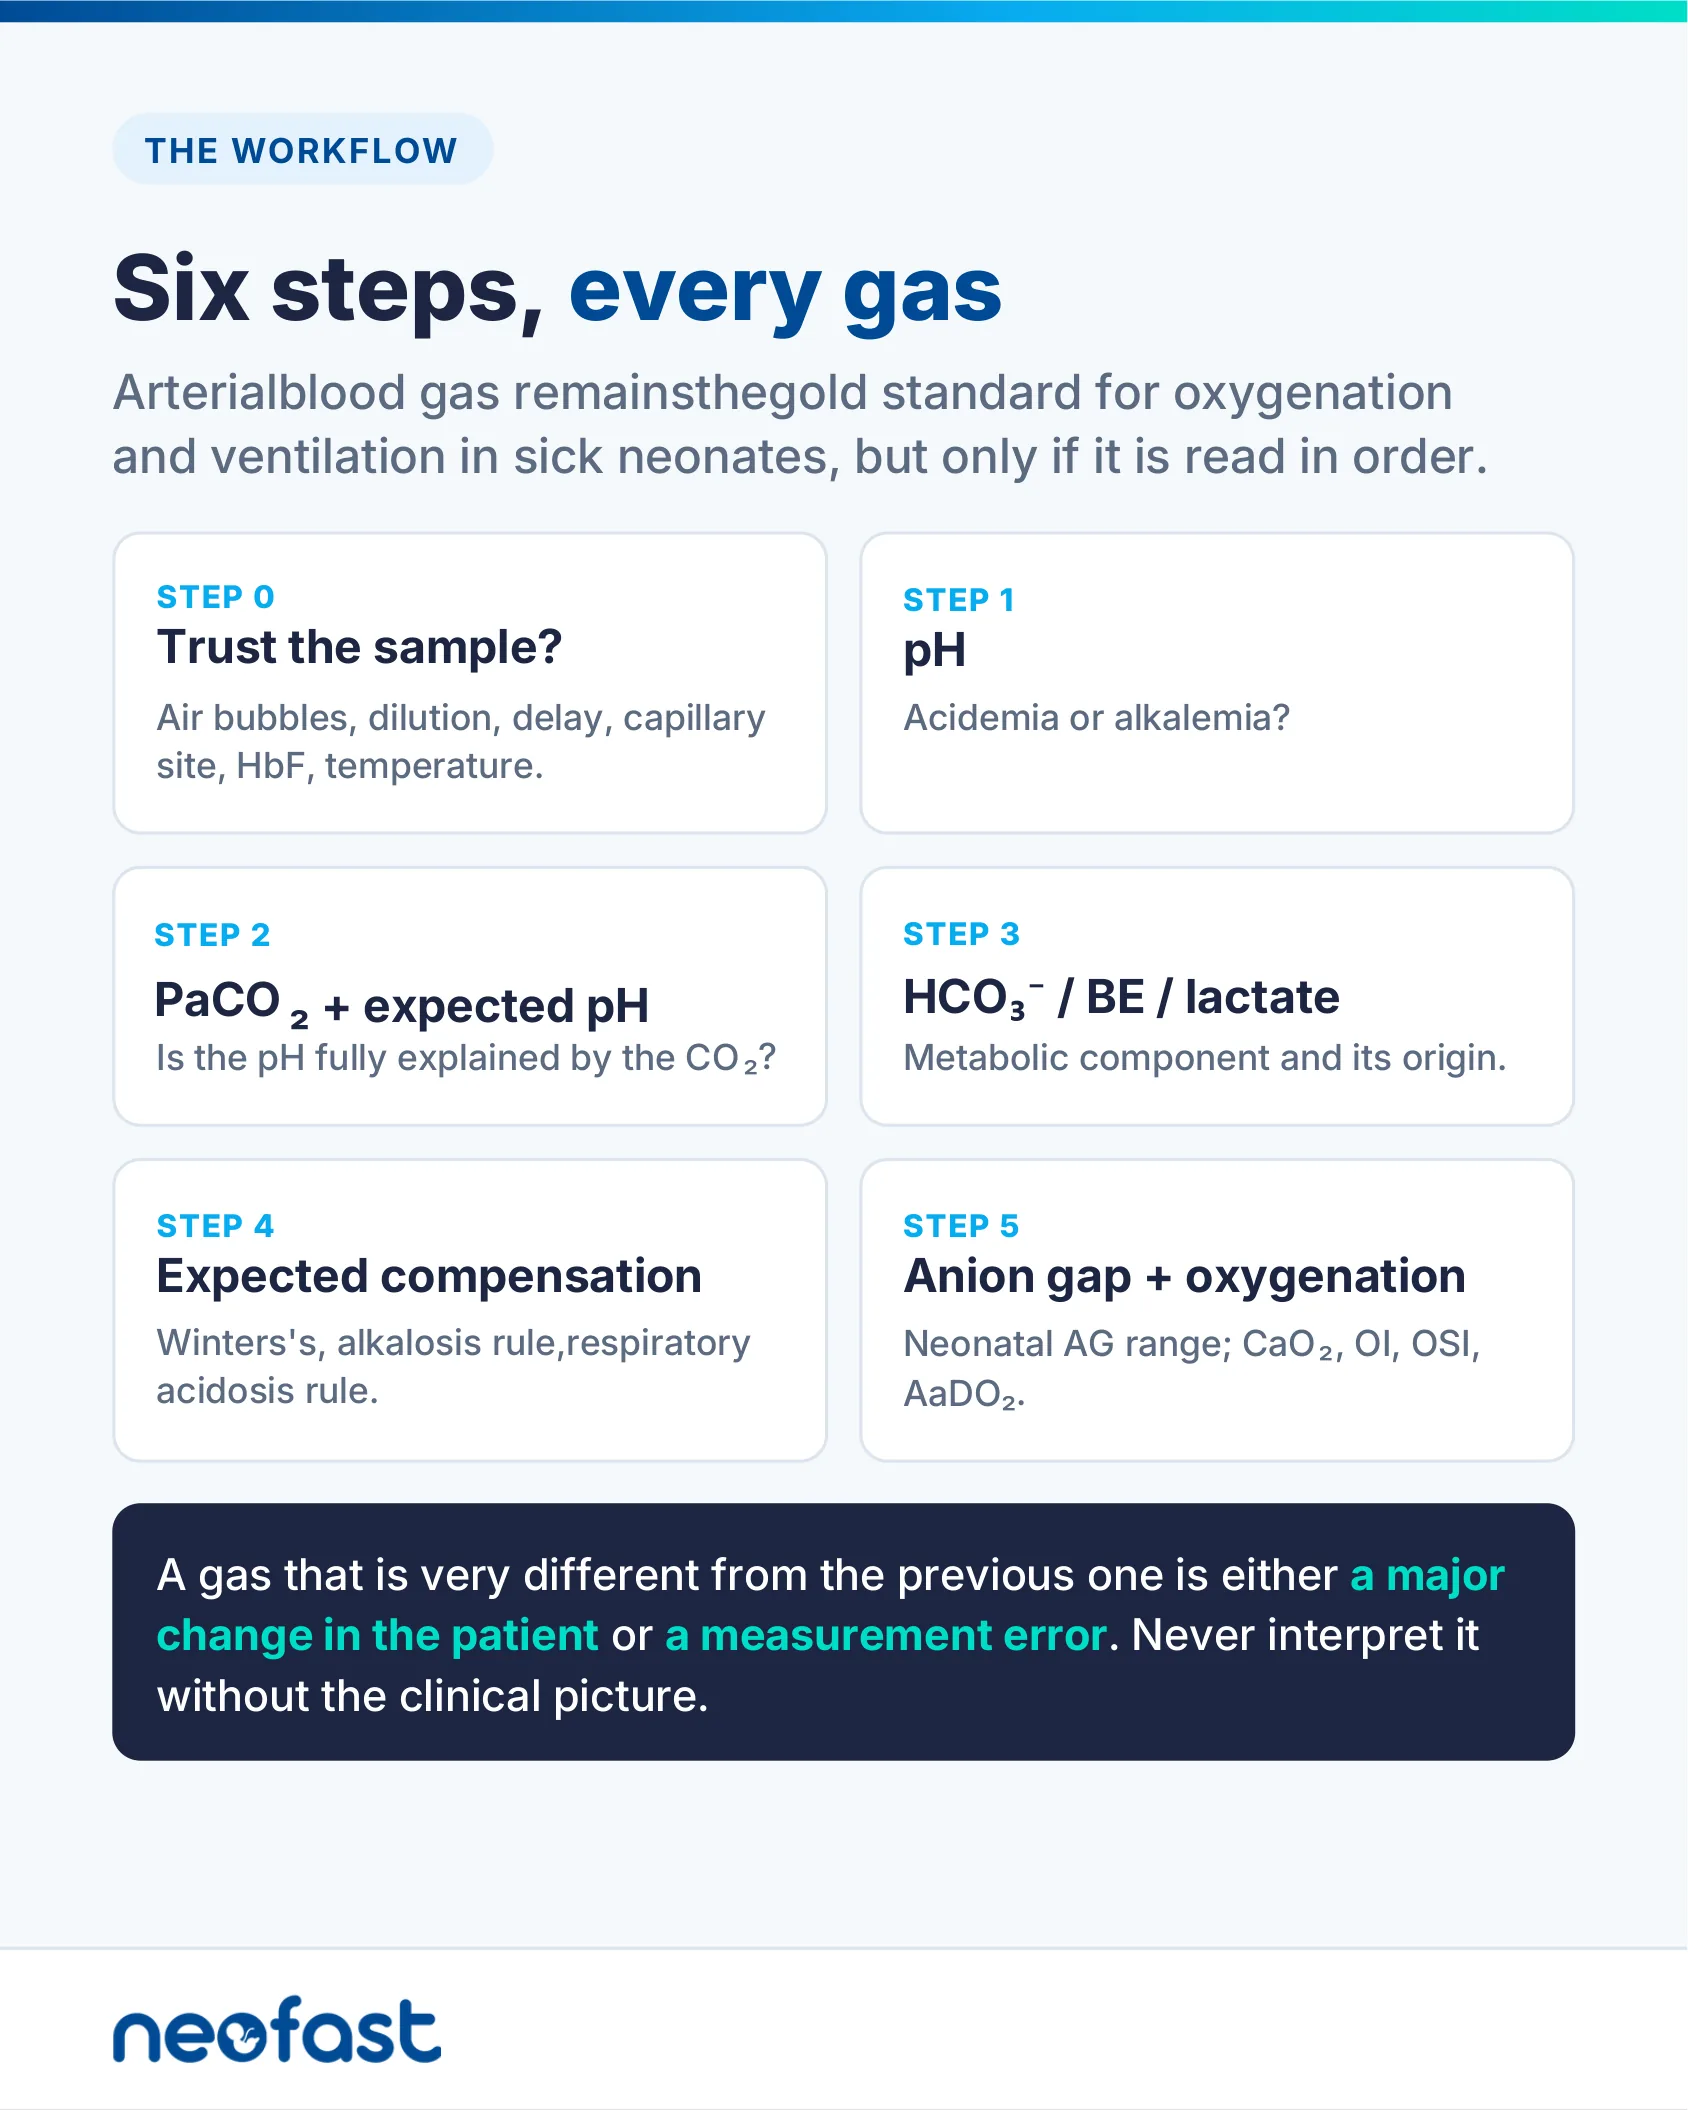
Arterial blood gas remains the gold standard for oxygenation and ventilation in sick neonates, but only if it is read in order.
Step 0: Trust the sample?
Air bubbles, dilution, delay, capillary site, HbF, temperature.
Step 1: pH
Acidemia or alkalemia?
Step 2: PaCO₂ + expected pH
Is the pH fully explained by the CO₂?
Step 3: HCO₃⁻ / BE / lactate
Metabolic component and its origin.
Step 4: Expected compensation
Winters’s, alkalosis rule, respiratory acidosis rule.
Step 5: Anion gap + oxygenation
Neonatal AG range; CaO₂, OI, OSI, AaDO₂.
A gas that is very different from the previous one is either a major change in the patient or a measurement error. Never interpret it without the clinical picture.
Step 0 · Sample Quality
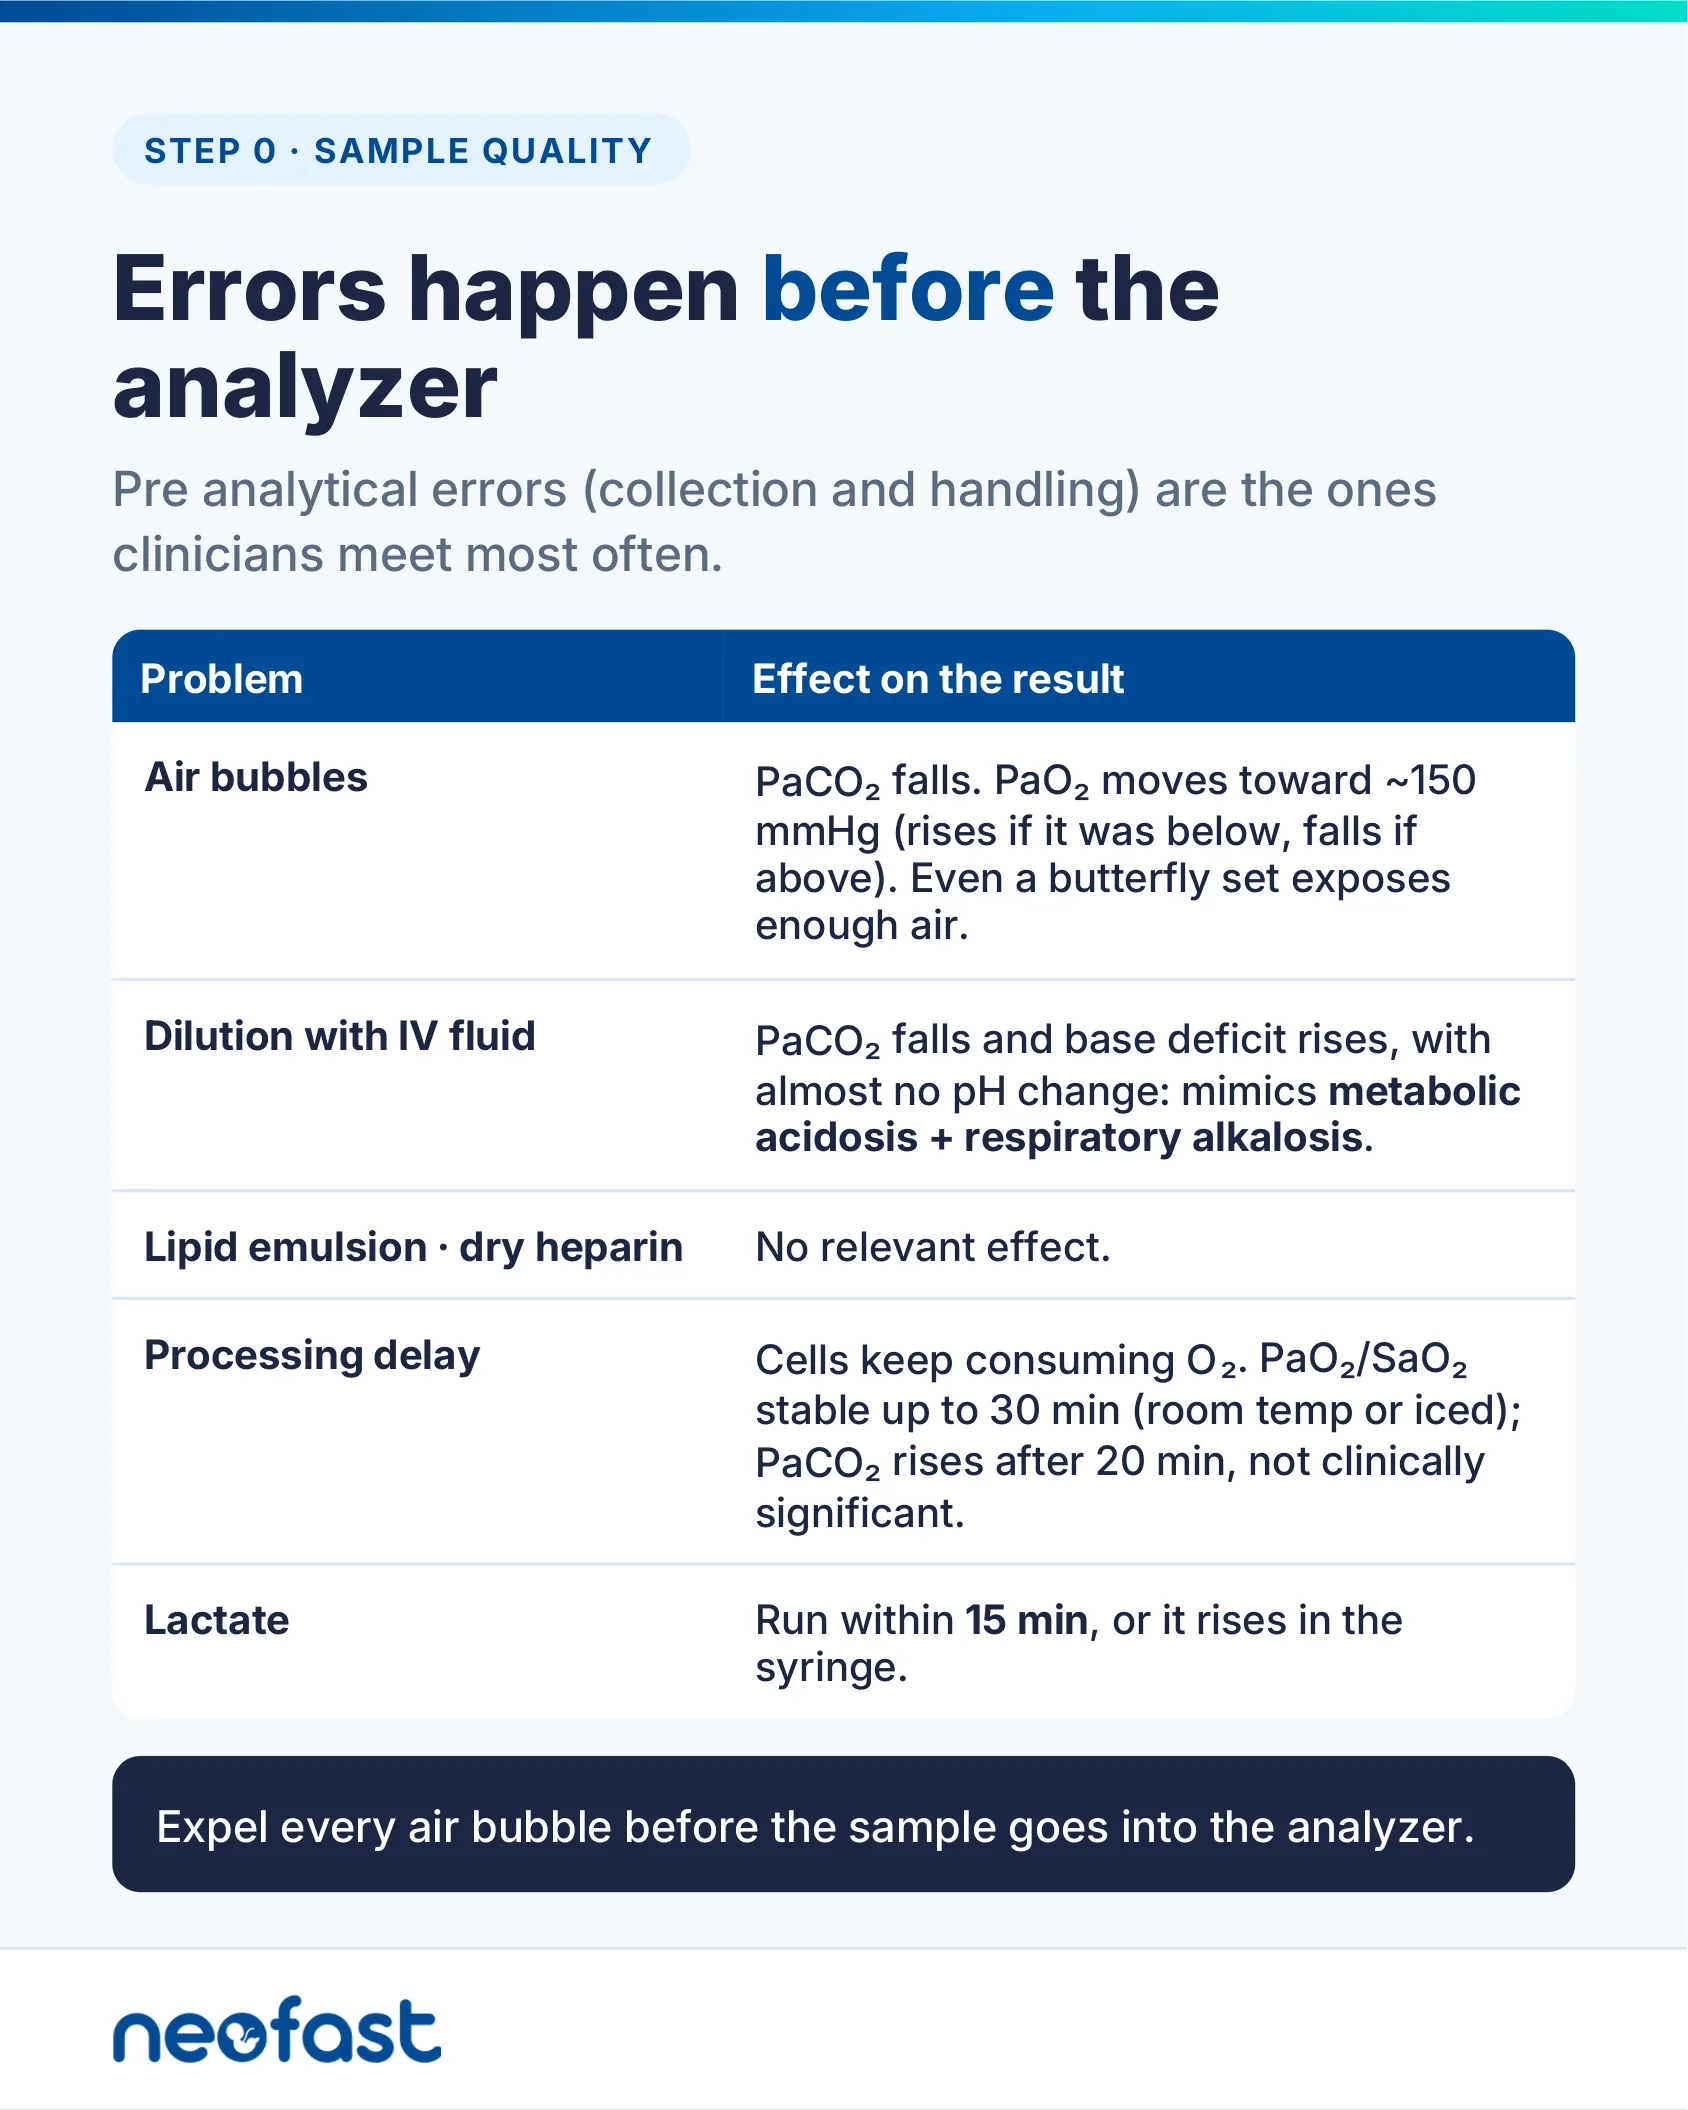
Pre analytical errors (collection and handling) are the ones clinicians meet most often.
| Problem | Effect on the result |
|---|---|
| Air bubbles | PaCO₂ falls. PaO₂ moves toward ~150 mmHg (rises if it was below, falls if above). Even a butterfly set exposes enough air. |
| Dilution with IV fluid | PaCO₂ falls and base deficit rises, with almost no pH change: mimics metabolic acidosis + respiratory alkalosis. |
| Lipid emulsion · dry heparin | No relevant effect. |
| Processing delay | Cells keep consuming O₂. PaO₂/SaO₂ stable up to 30 min (room temp or iced); PaCO₂ rises after 20 min, not clinically significant. |
| Lactate | Run within 15 min, or it rises in the syringe. |
Expel every air bubble before the sample goes into the analyzer.
Step 0 · Neonatal Traps
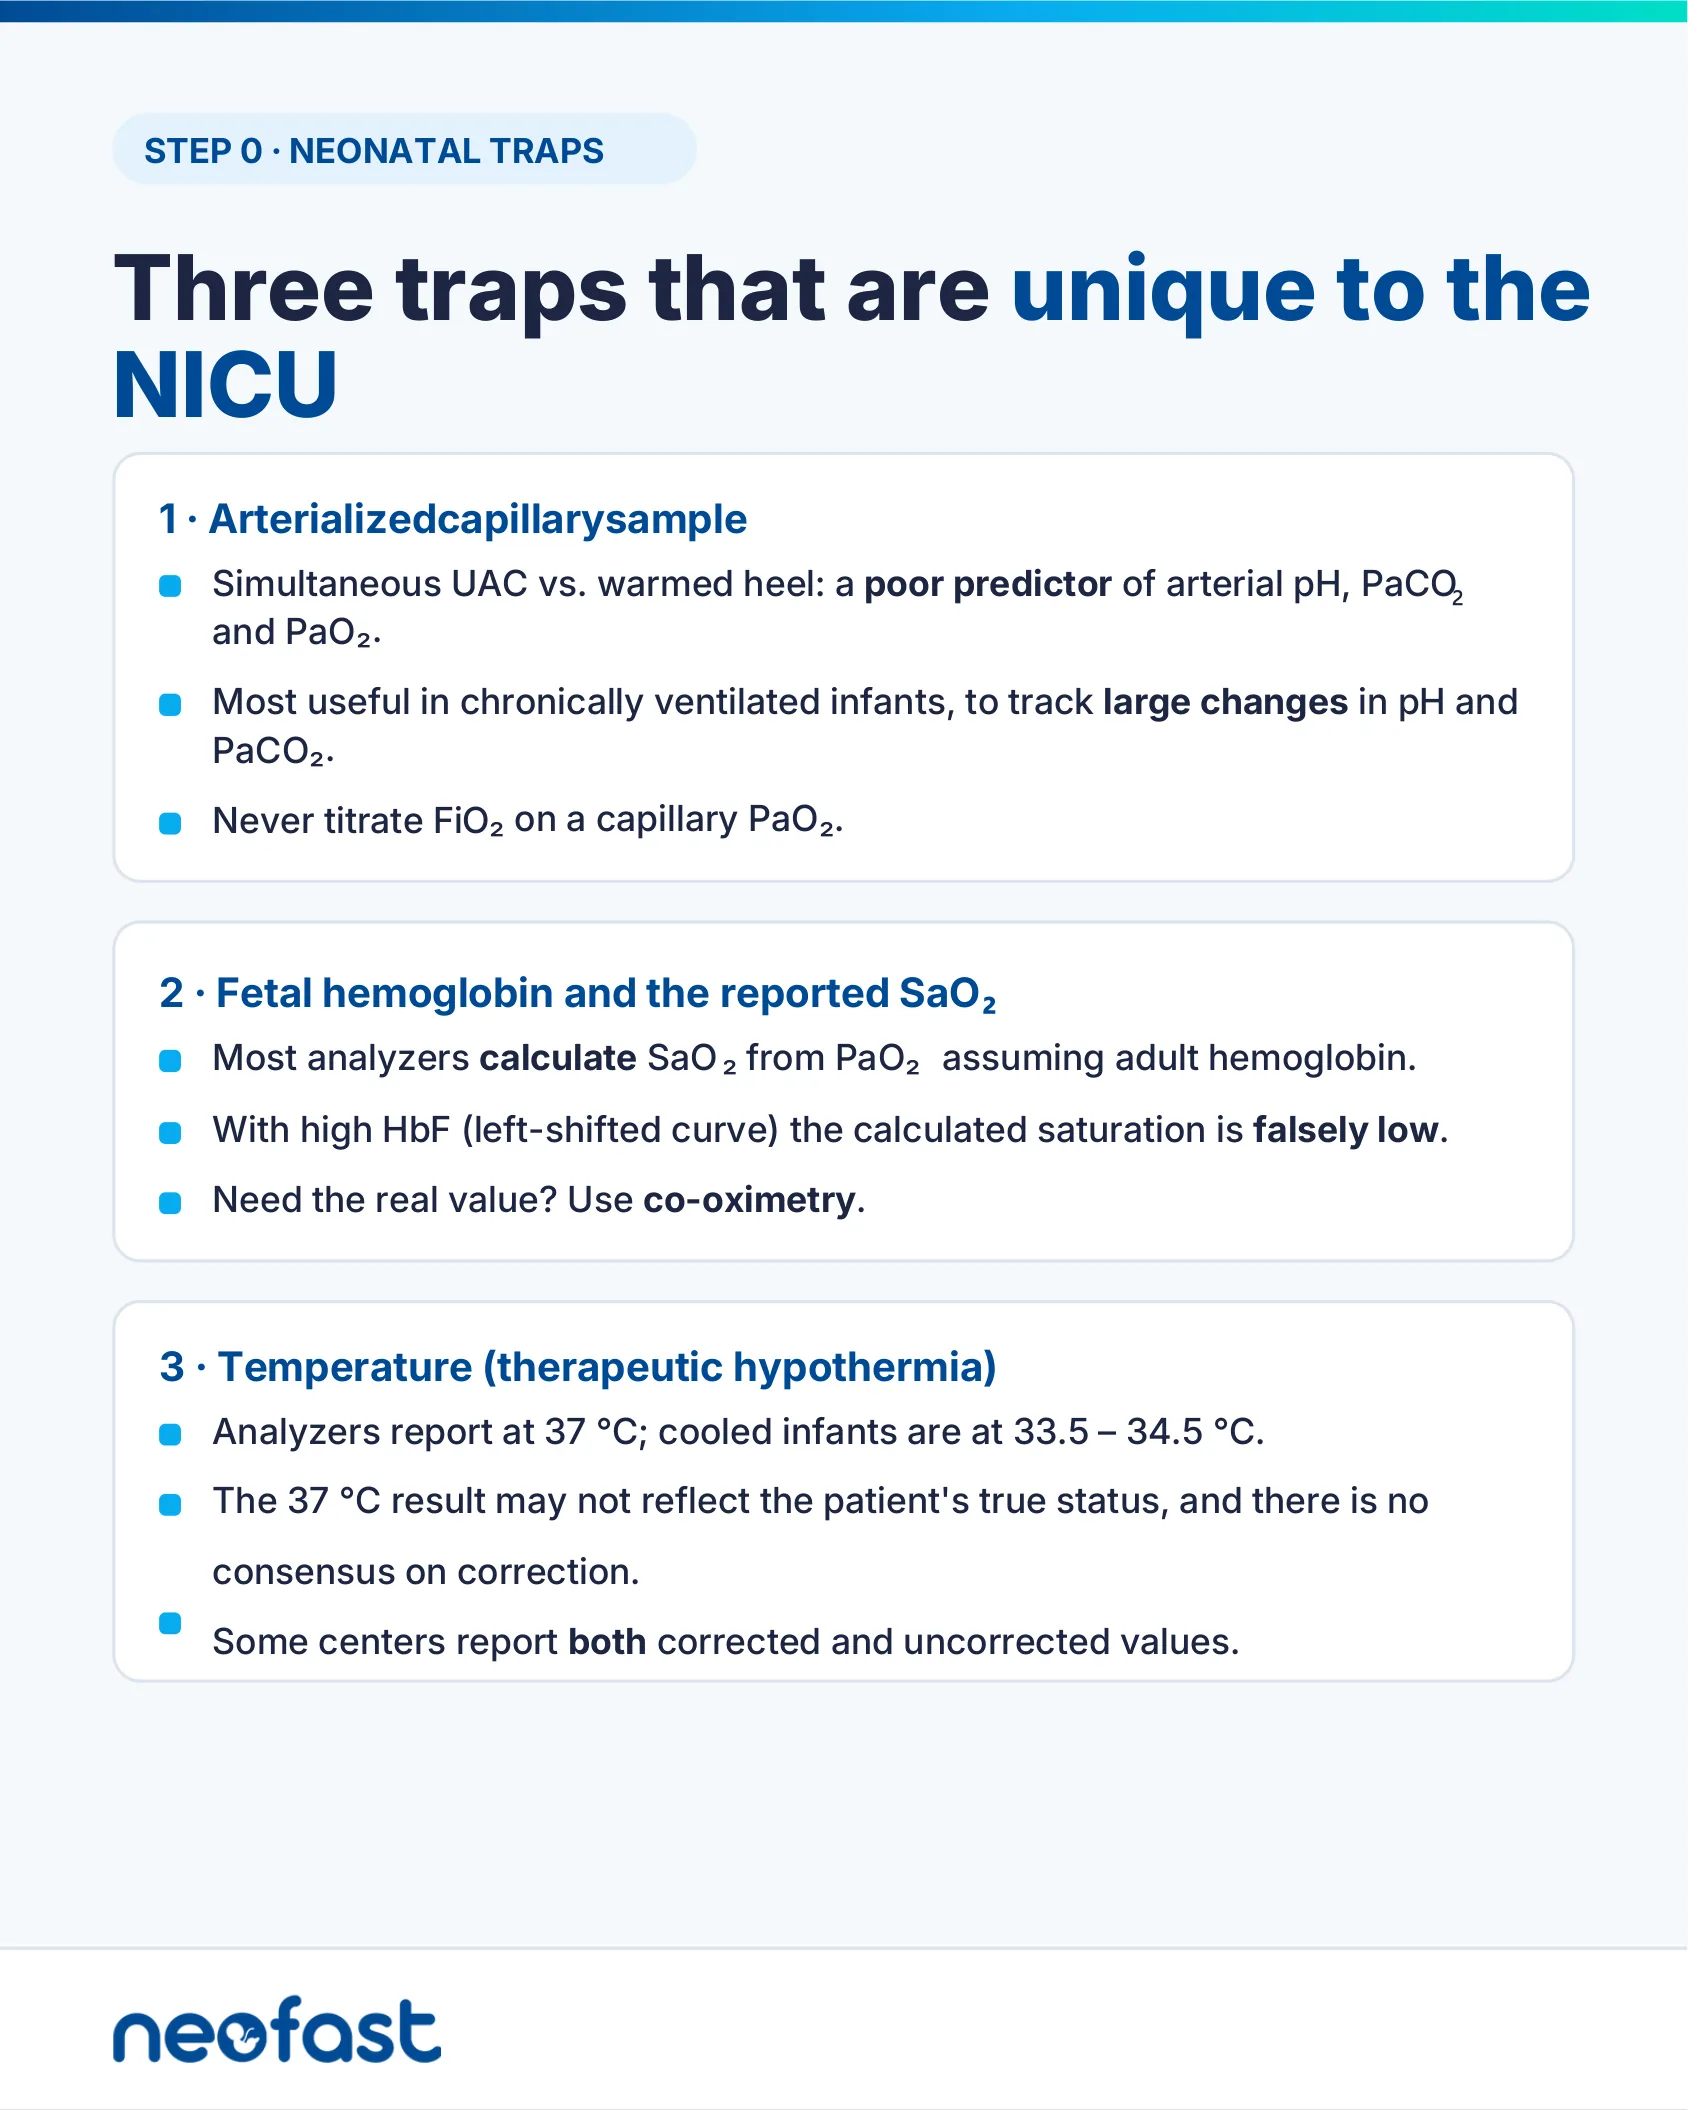
1 · Arterialized capillary sample
- Simultaneous UAC vs. warmed heel: a poor predictor of arterial pH, PaCO₂ and PaO₂.
- Most useful in chronically ventilated infants, to track large changes in pH and PaCO₂.
- Never titrate FiO₂ on a capillary PaO₂.
2 · Fetal hemoglobin and the reported SaO₂
- Most analyzers calculate SaO₂ from PaO₂ assuming adult hemoglobin.
- With high HbF (left-shifted curve) the calculated saturation is falsely low.
- Need the real value? Use co-oximetry.
3 · Temperature (therapeutic hypothermia)
- Analyzers report at 37 °C; cooled infants are at 33.5–34.5 °C.
- The 37 °C result may not reflect the patient’s true status, and there is no consensus on correction.
- Some centers report both corrected and uncorrected values.
Step 1 · pH
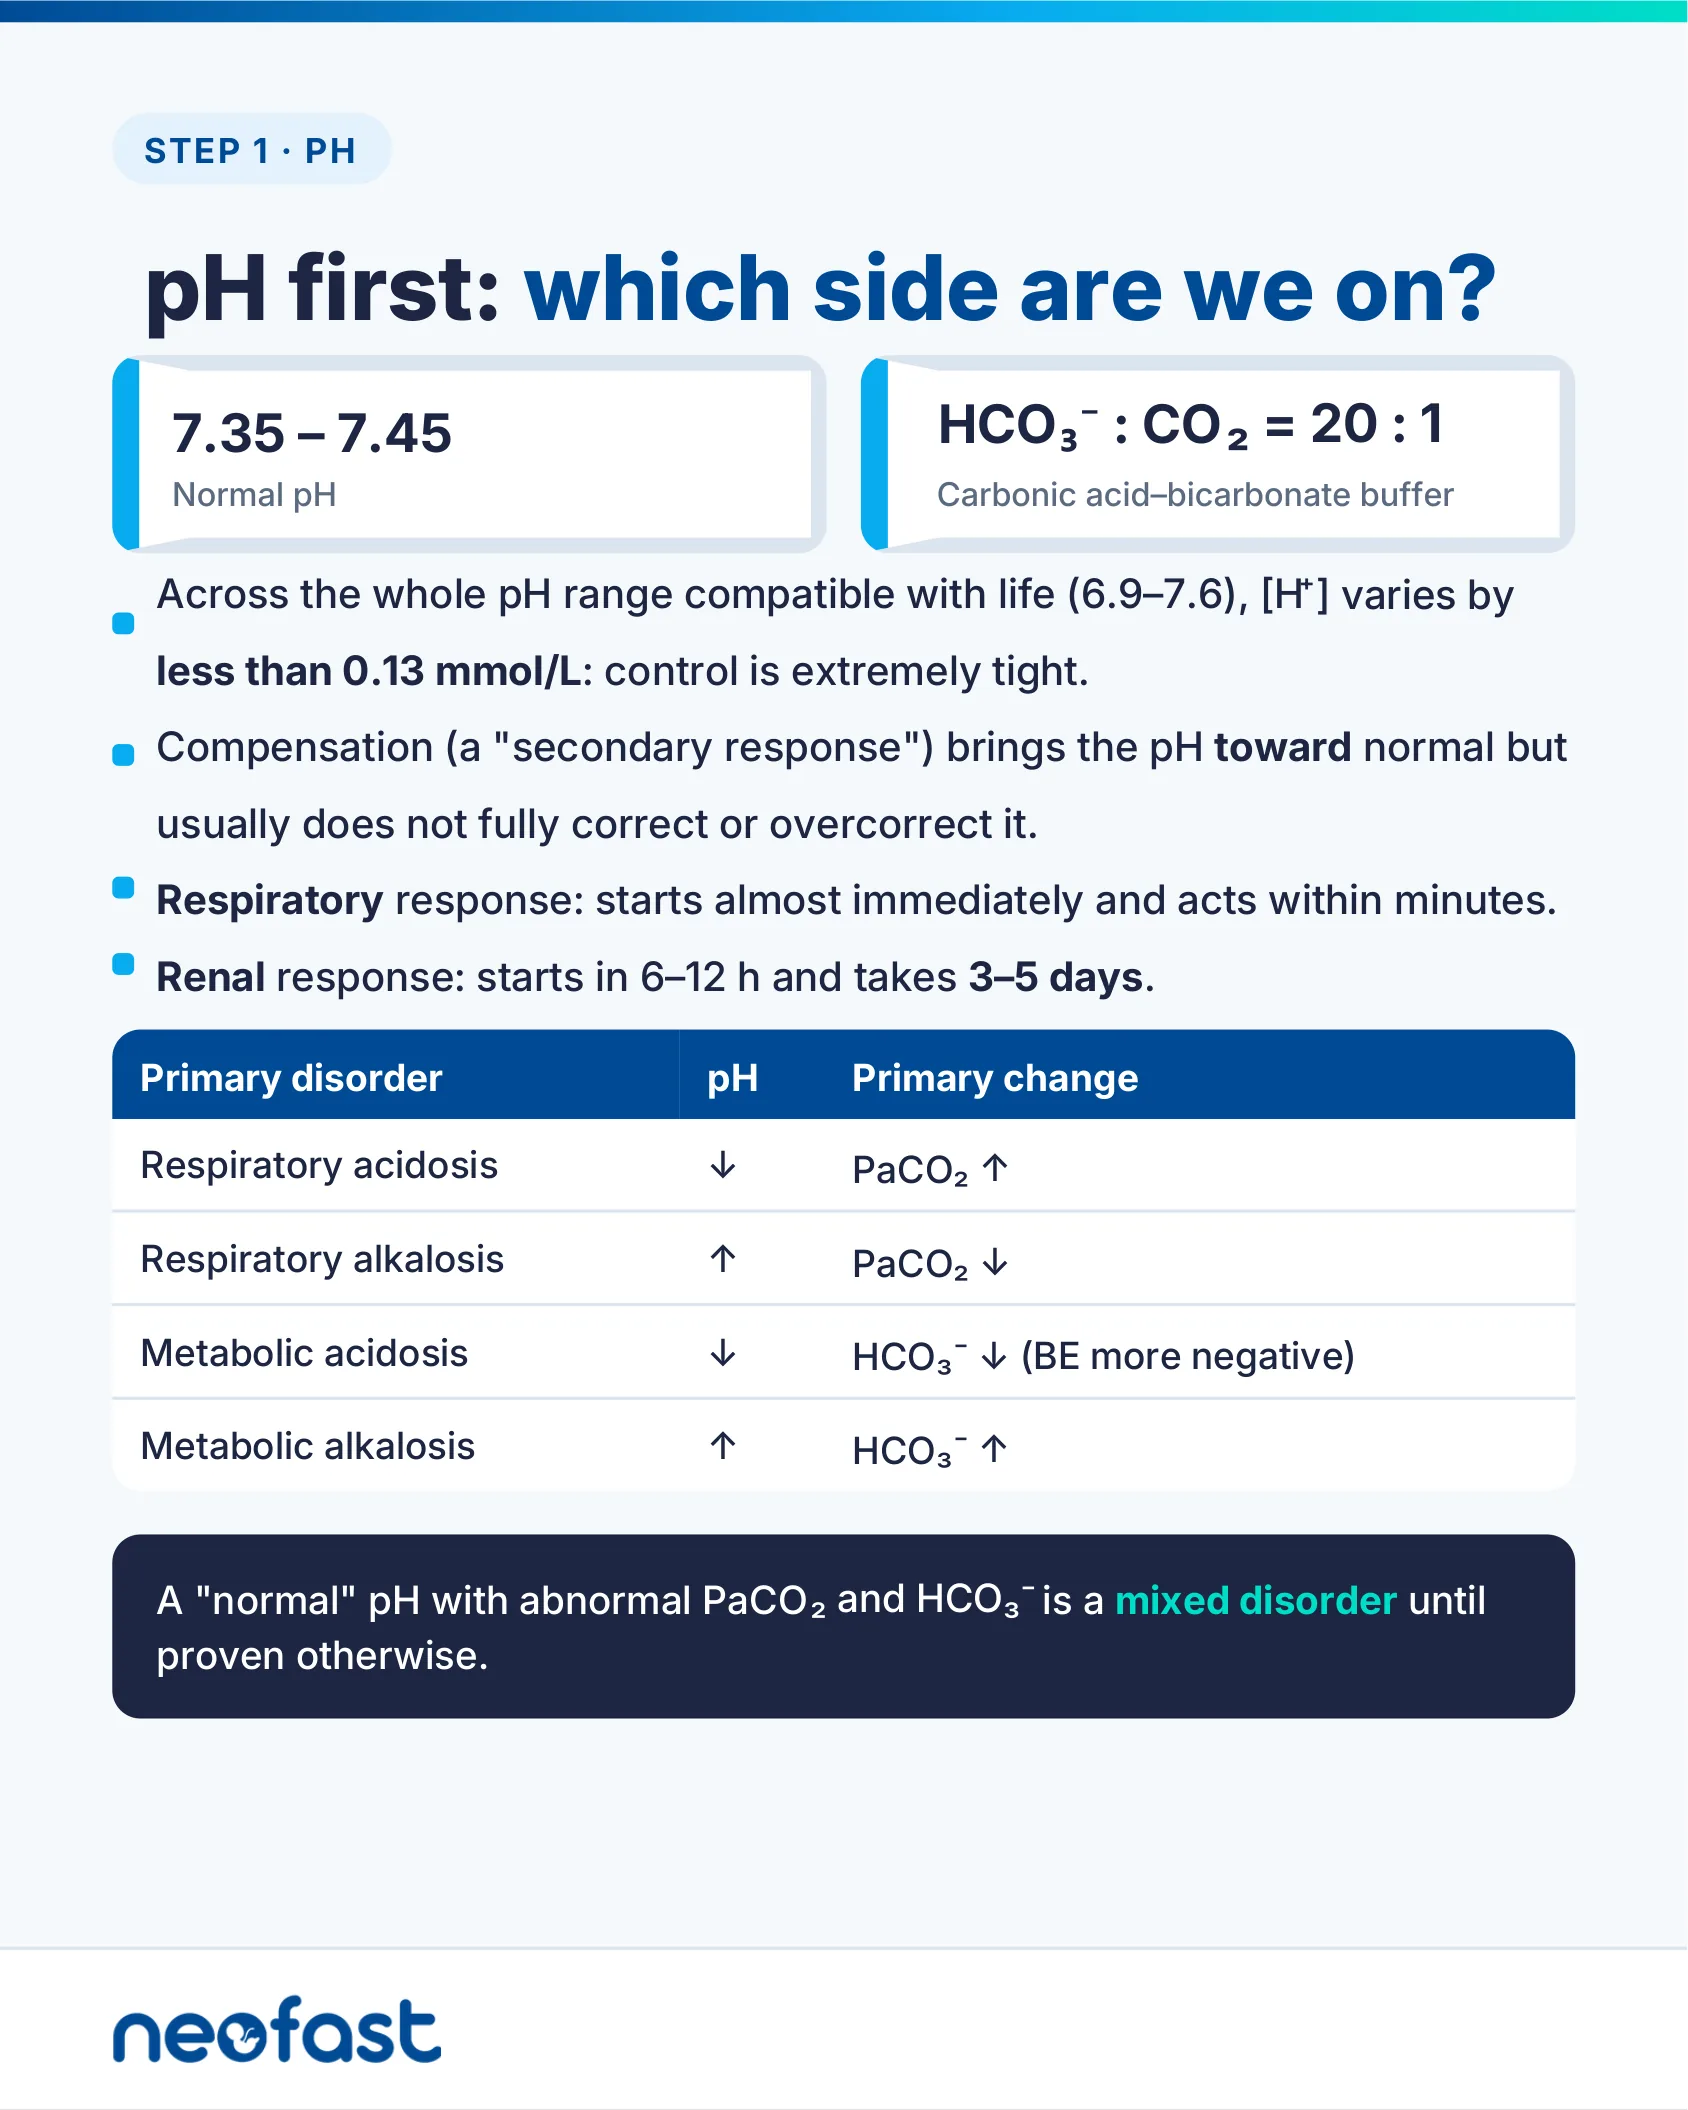
- 7.35 – 7.45 — Normal pH
- HCO₃⁻ : CO₂ = 20 : 1 — Carbonic acid–bicarbonate buffer
- Across the whole pH range compatible with life (6.9–7.6), [H⁺] varies by less than 0.13 mmol/L: control is extremely tight.
- Compensation (a “secondary response”) brings the pH toward normal but usually does not fully correct or overcorrect it.
- Respiratory response: starts almost immediately and acts within minutes.
- Renal response: starts in 6–12 h and takes 3–5 days.
| Primary disorder | pH | Primary change |
|---|---|---|
| Respiratory acidosis | ↓ | PaCO₂ ↑ |
| Respiratory alkalosis | ↑ | PaCO₂ ↓ |
| Metabolic acidosis | ↓ | HCO₃⁻ ↓ (BE more negative) |
| Metabolic alkalosis | ↑ | HCO₃⁻ ↑ |
A “normal” pH with abnormal PaCO₂ and HCO₃⁻ is a mixed disorder until proven otherwise.
Step 2 · PaCO₂
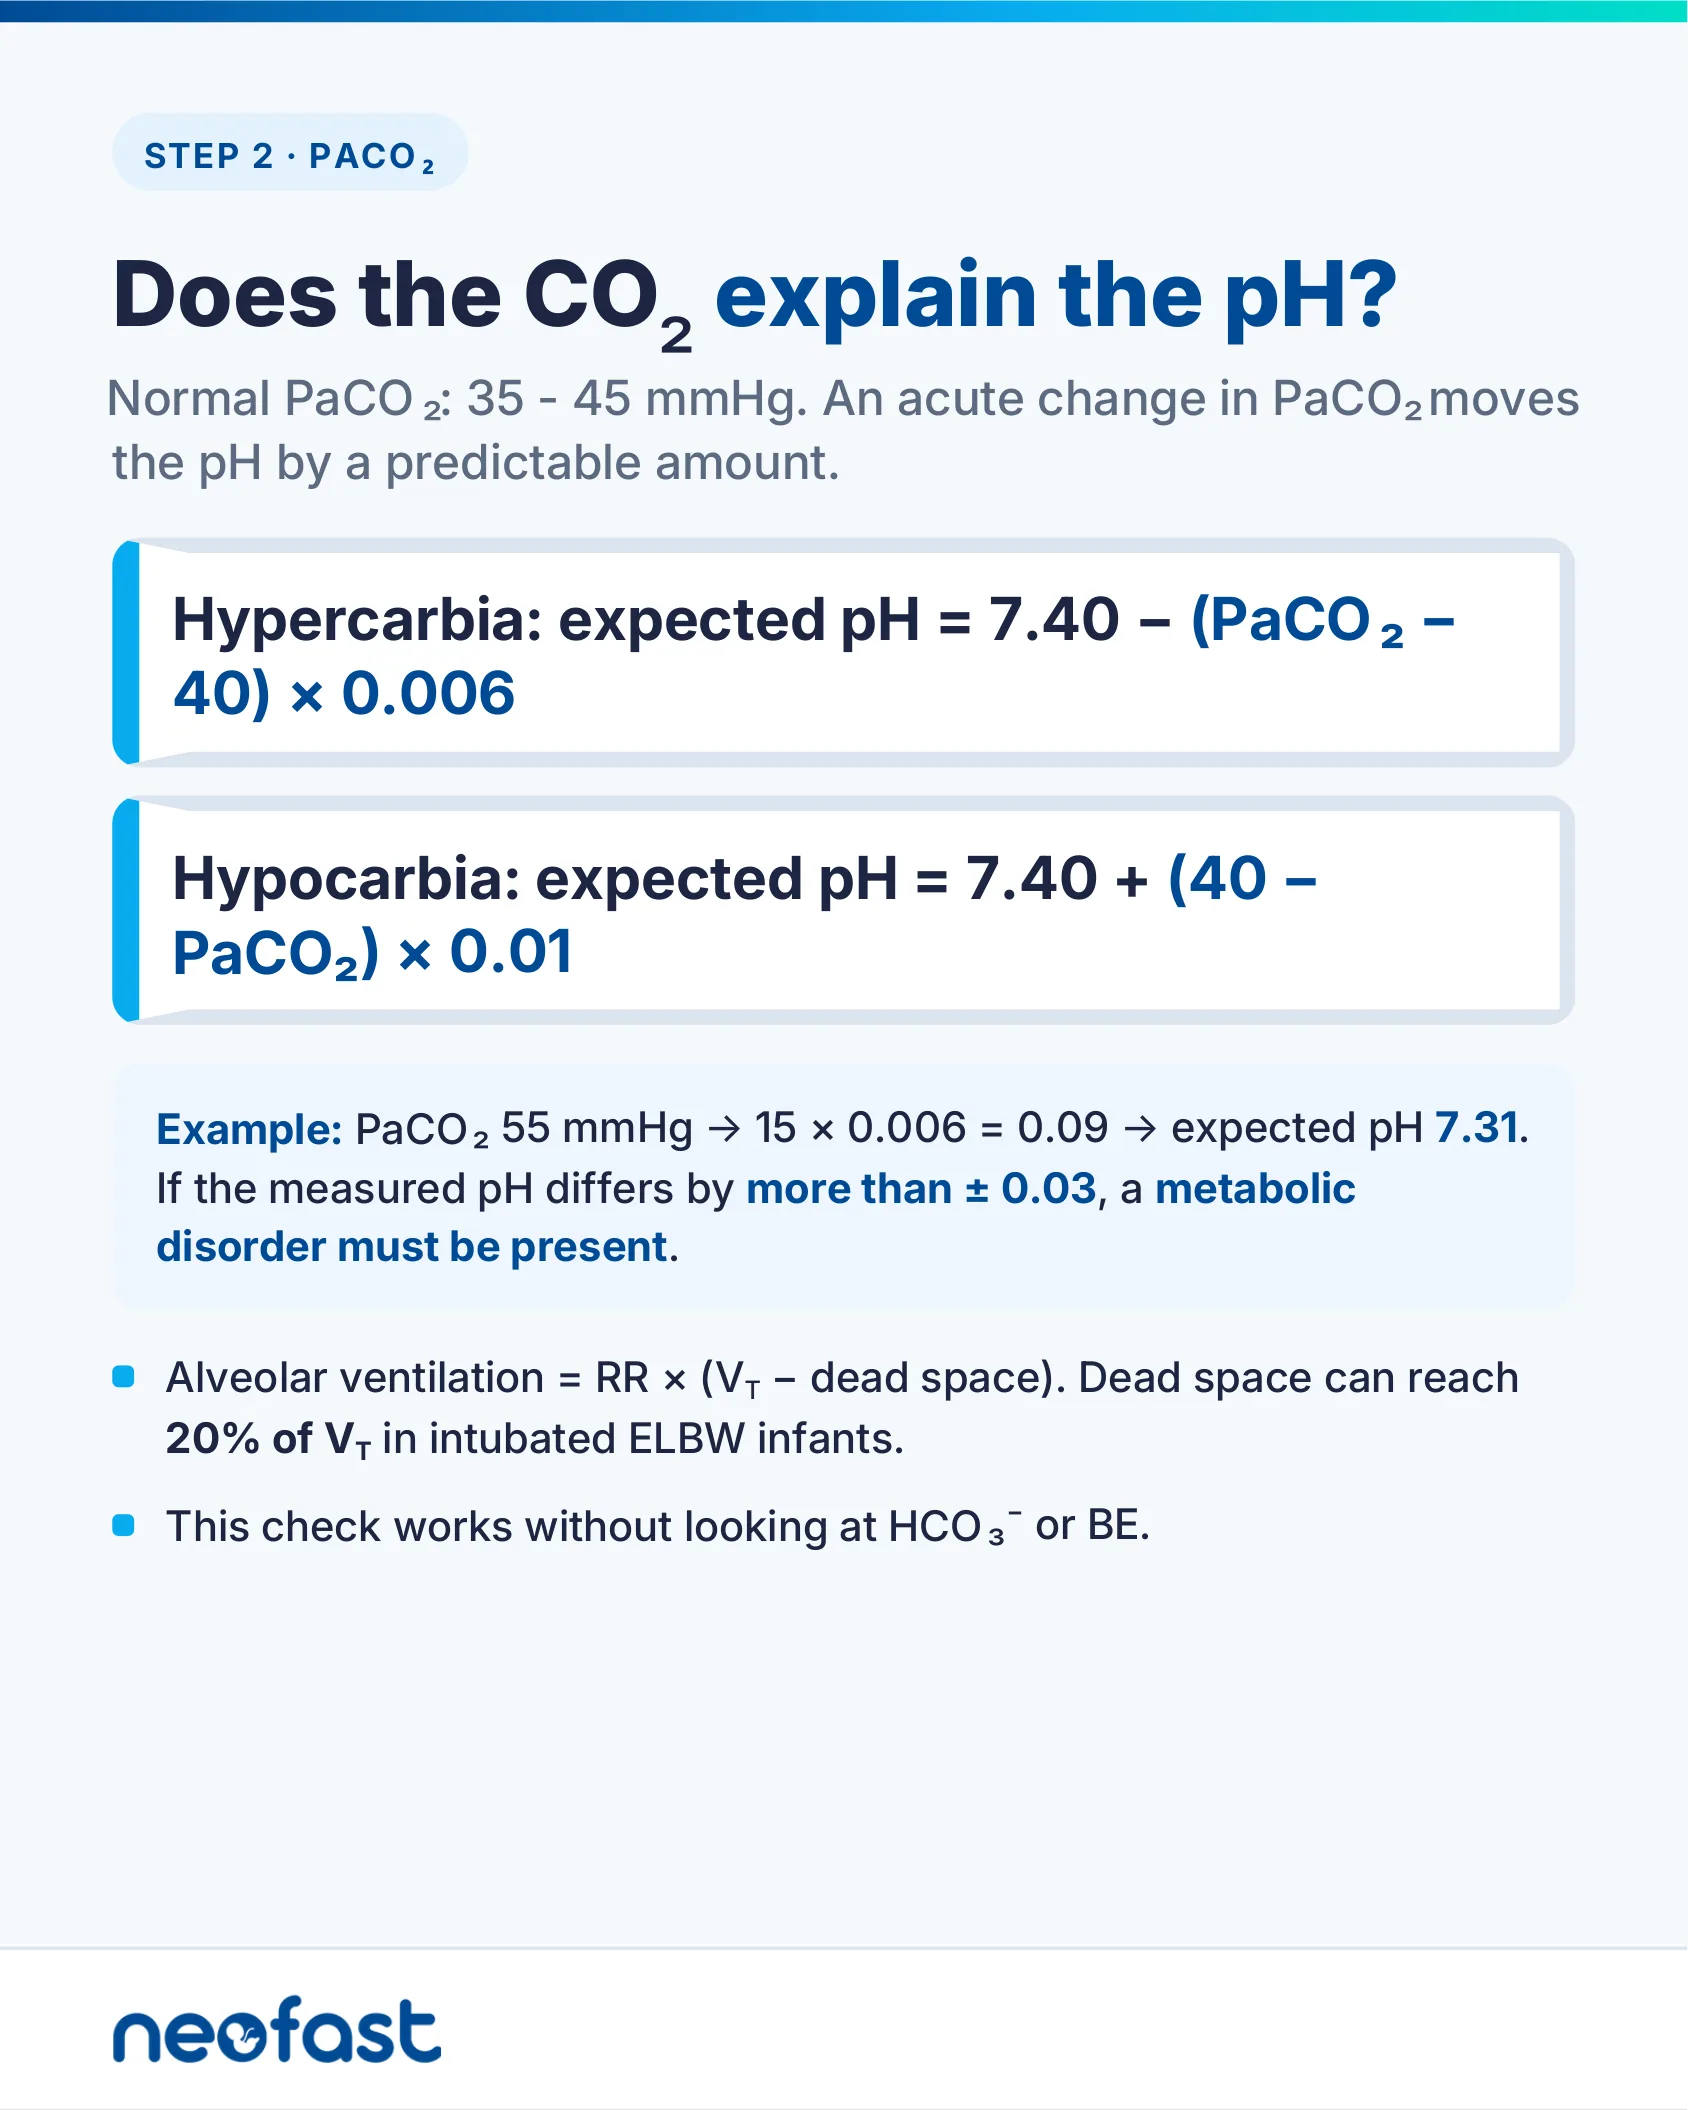
Normal PaCO₂: 35 – 45 mmHg. An acute change in PaCO₂ moves the pH by a predictable amount.
- Hypercarbia: expected pH = 7.40 – (PaCO₂ – 40) × 0.006
- Hypocarbia: expected pH = 7.40 + (40 – PaCO₂) × 0.01
Example: PaCO₂ 55 mmHg → 15 × 0.006 = 0.09 → expected pH 7.31. If the measured pH differs by more than ± 0.03, a metabolic disorder must be present.
- Alveolar ventilation = RR × (V_T – dead space). Dead space can reach 20% of V_T in intubated ELBW infants.
- This check works without looking at HCO₃⁻ or BE.
Step 3 · Metabolic Component
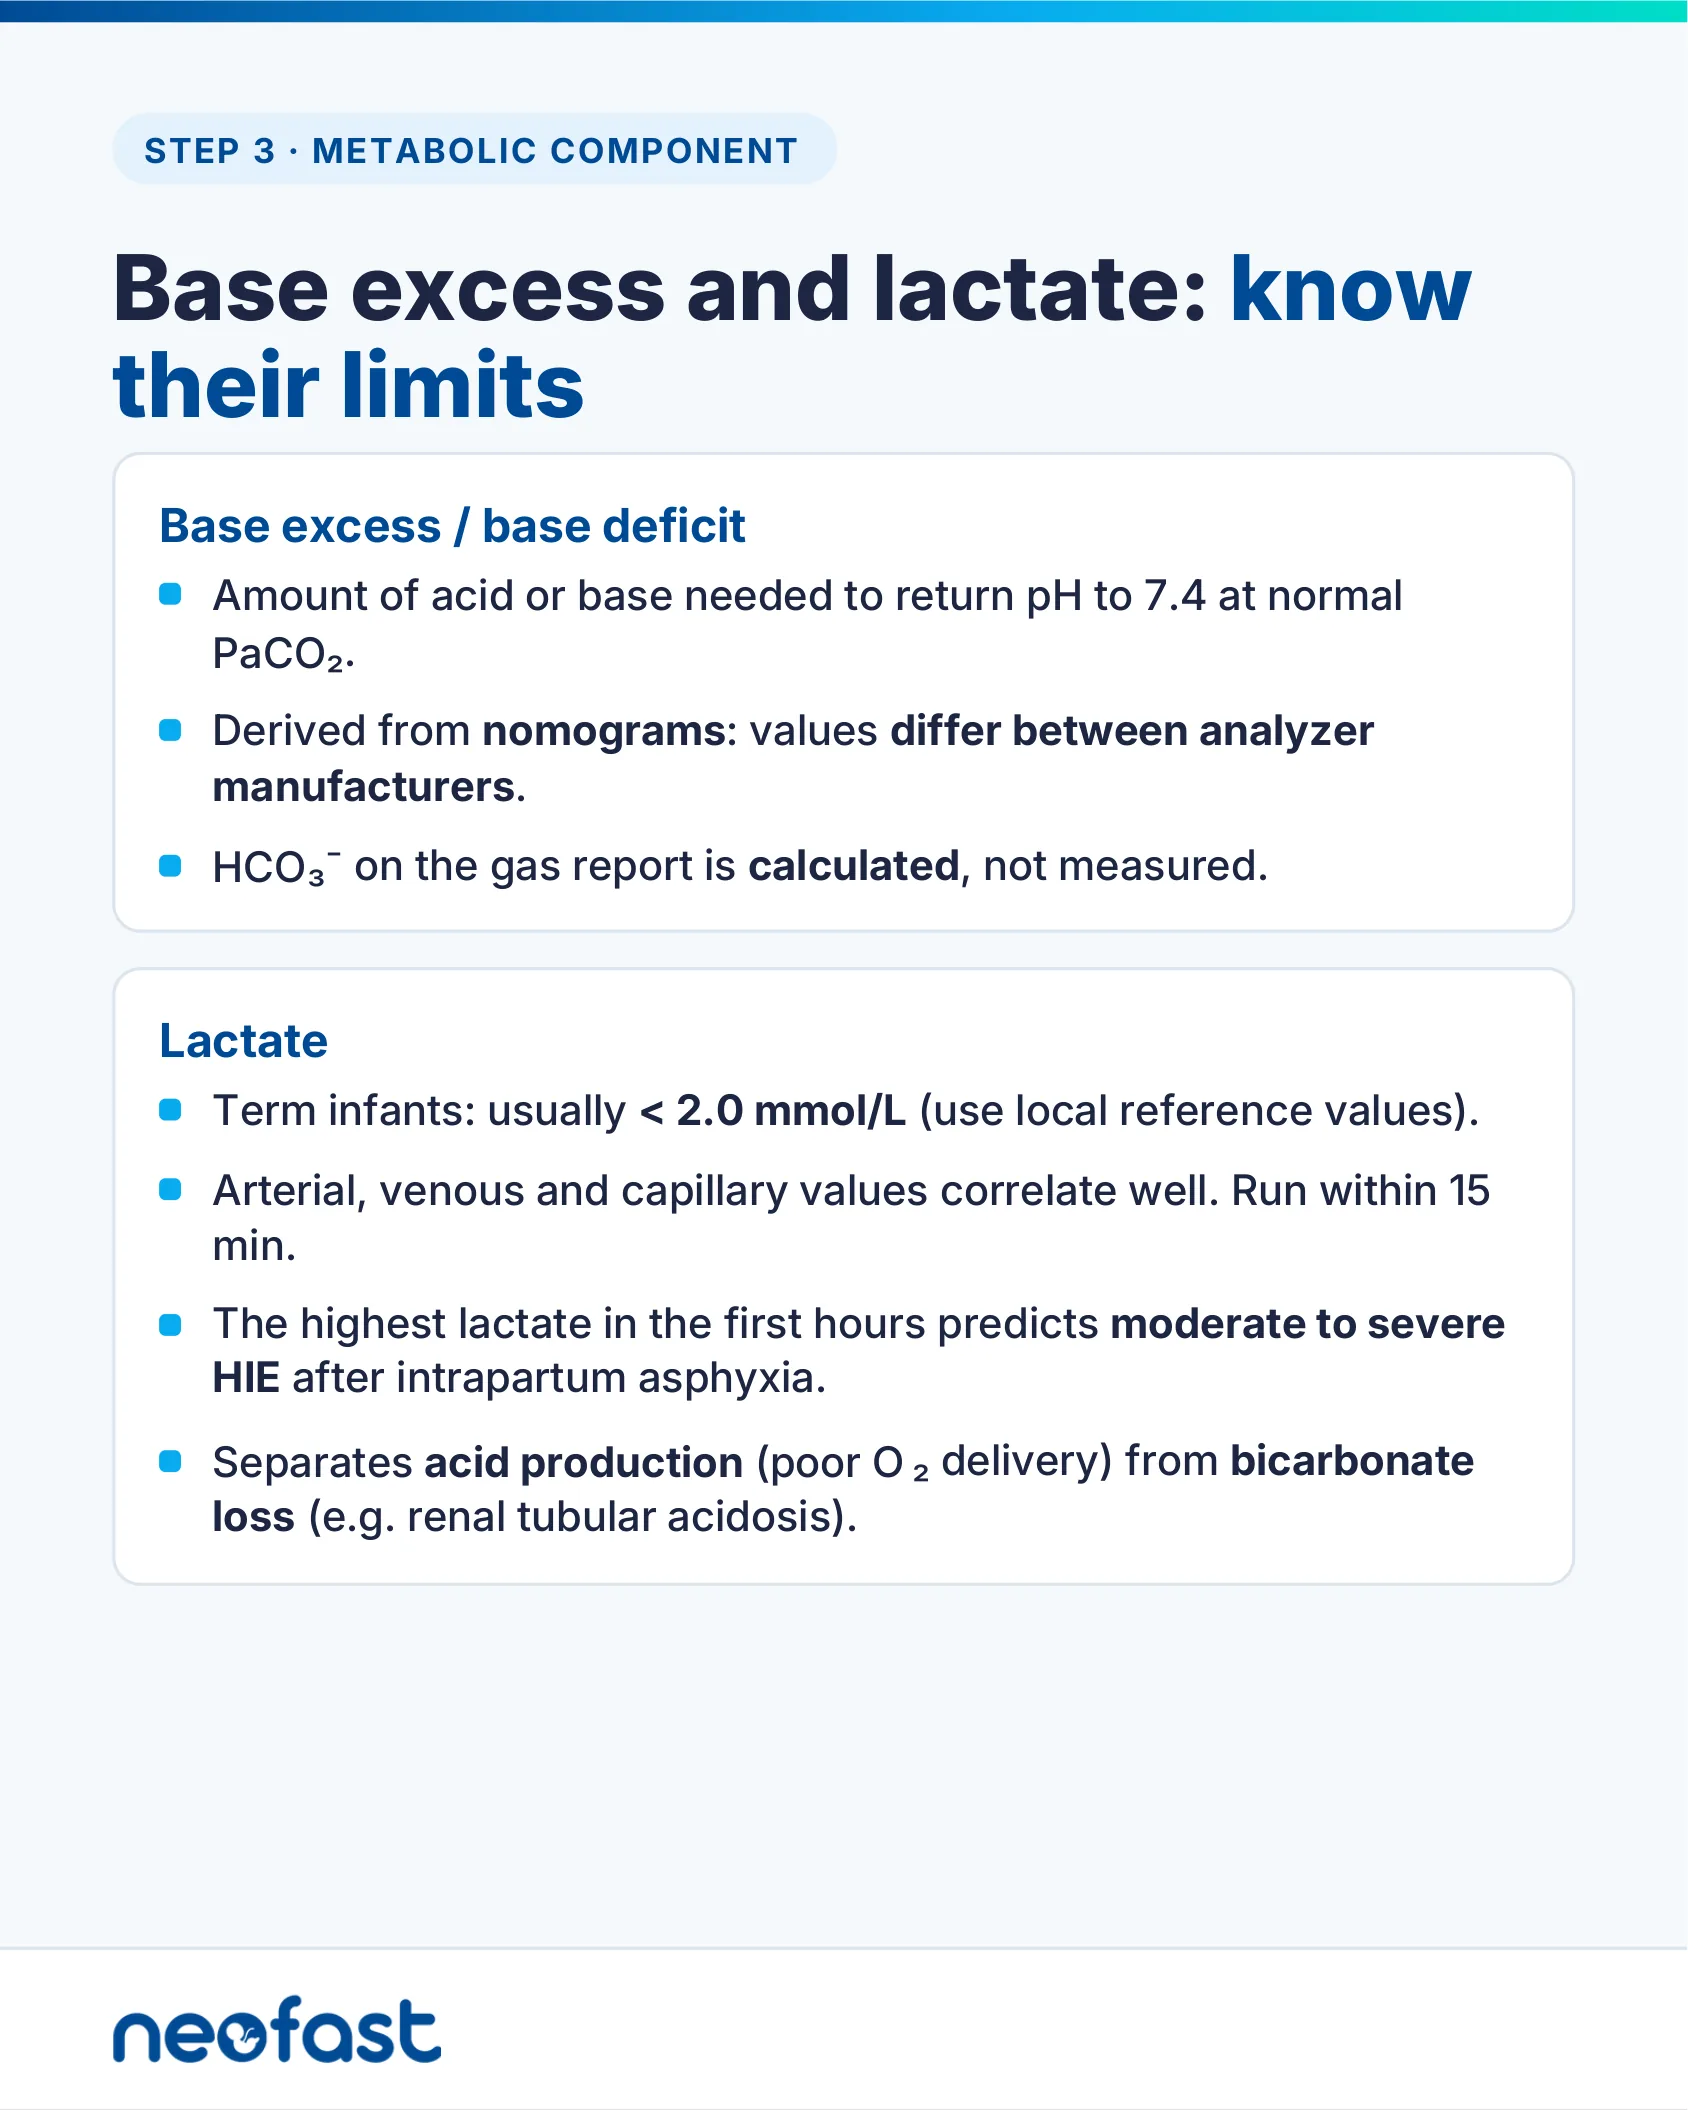
Base excess / base deficit
- Amount of acid or base needed to return pH to 7.4 at normal PaCO₂.
- Derived from nomograms: values differ between analyzer manufacturers.
- HCO₃⁻ on the gas report is calculated, not measured.
Lactate
- Term infants: usually < 2.0 mmol/L (use local reference values).
- Arterial, venous and capillary values correlate well. Run within 15 min.
- The highest lactate in the first hours predicts moderate to severe HIE after intrapartum asphyxia.
- Separates acid production (poor O₂ delivery) from bicarbonate loss (e.g. renal tubular acidosis).
Step 4 · Metabolic Acidosis
✓ Available in NeoFast
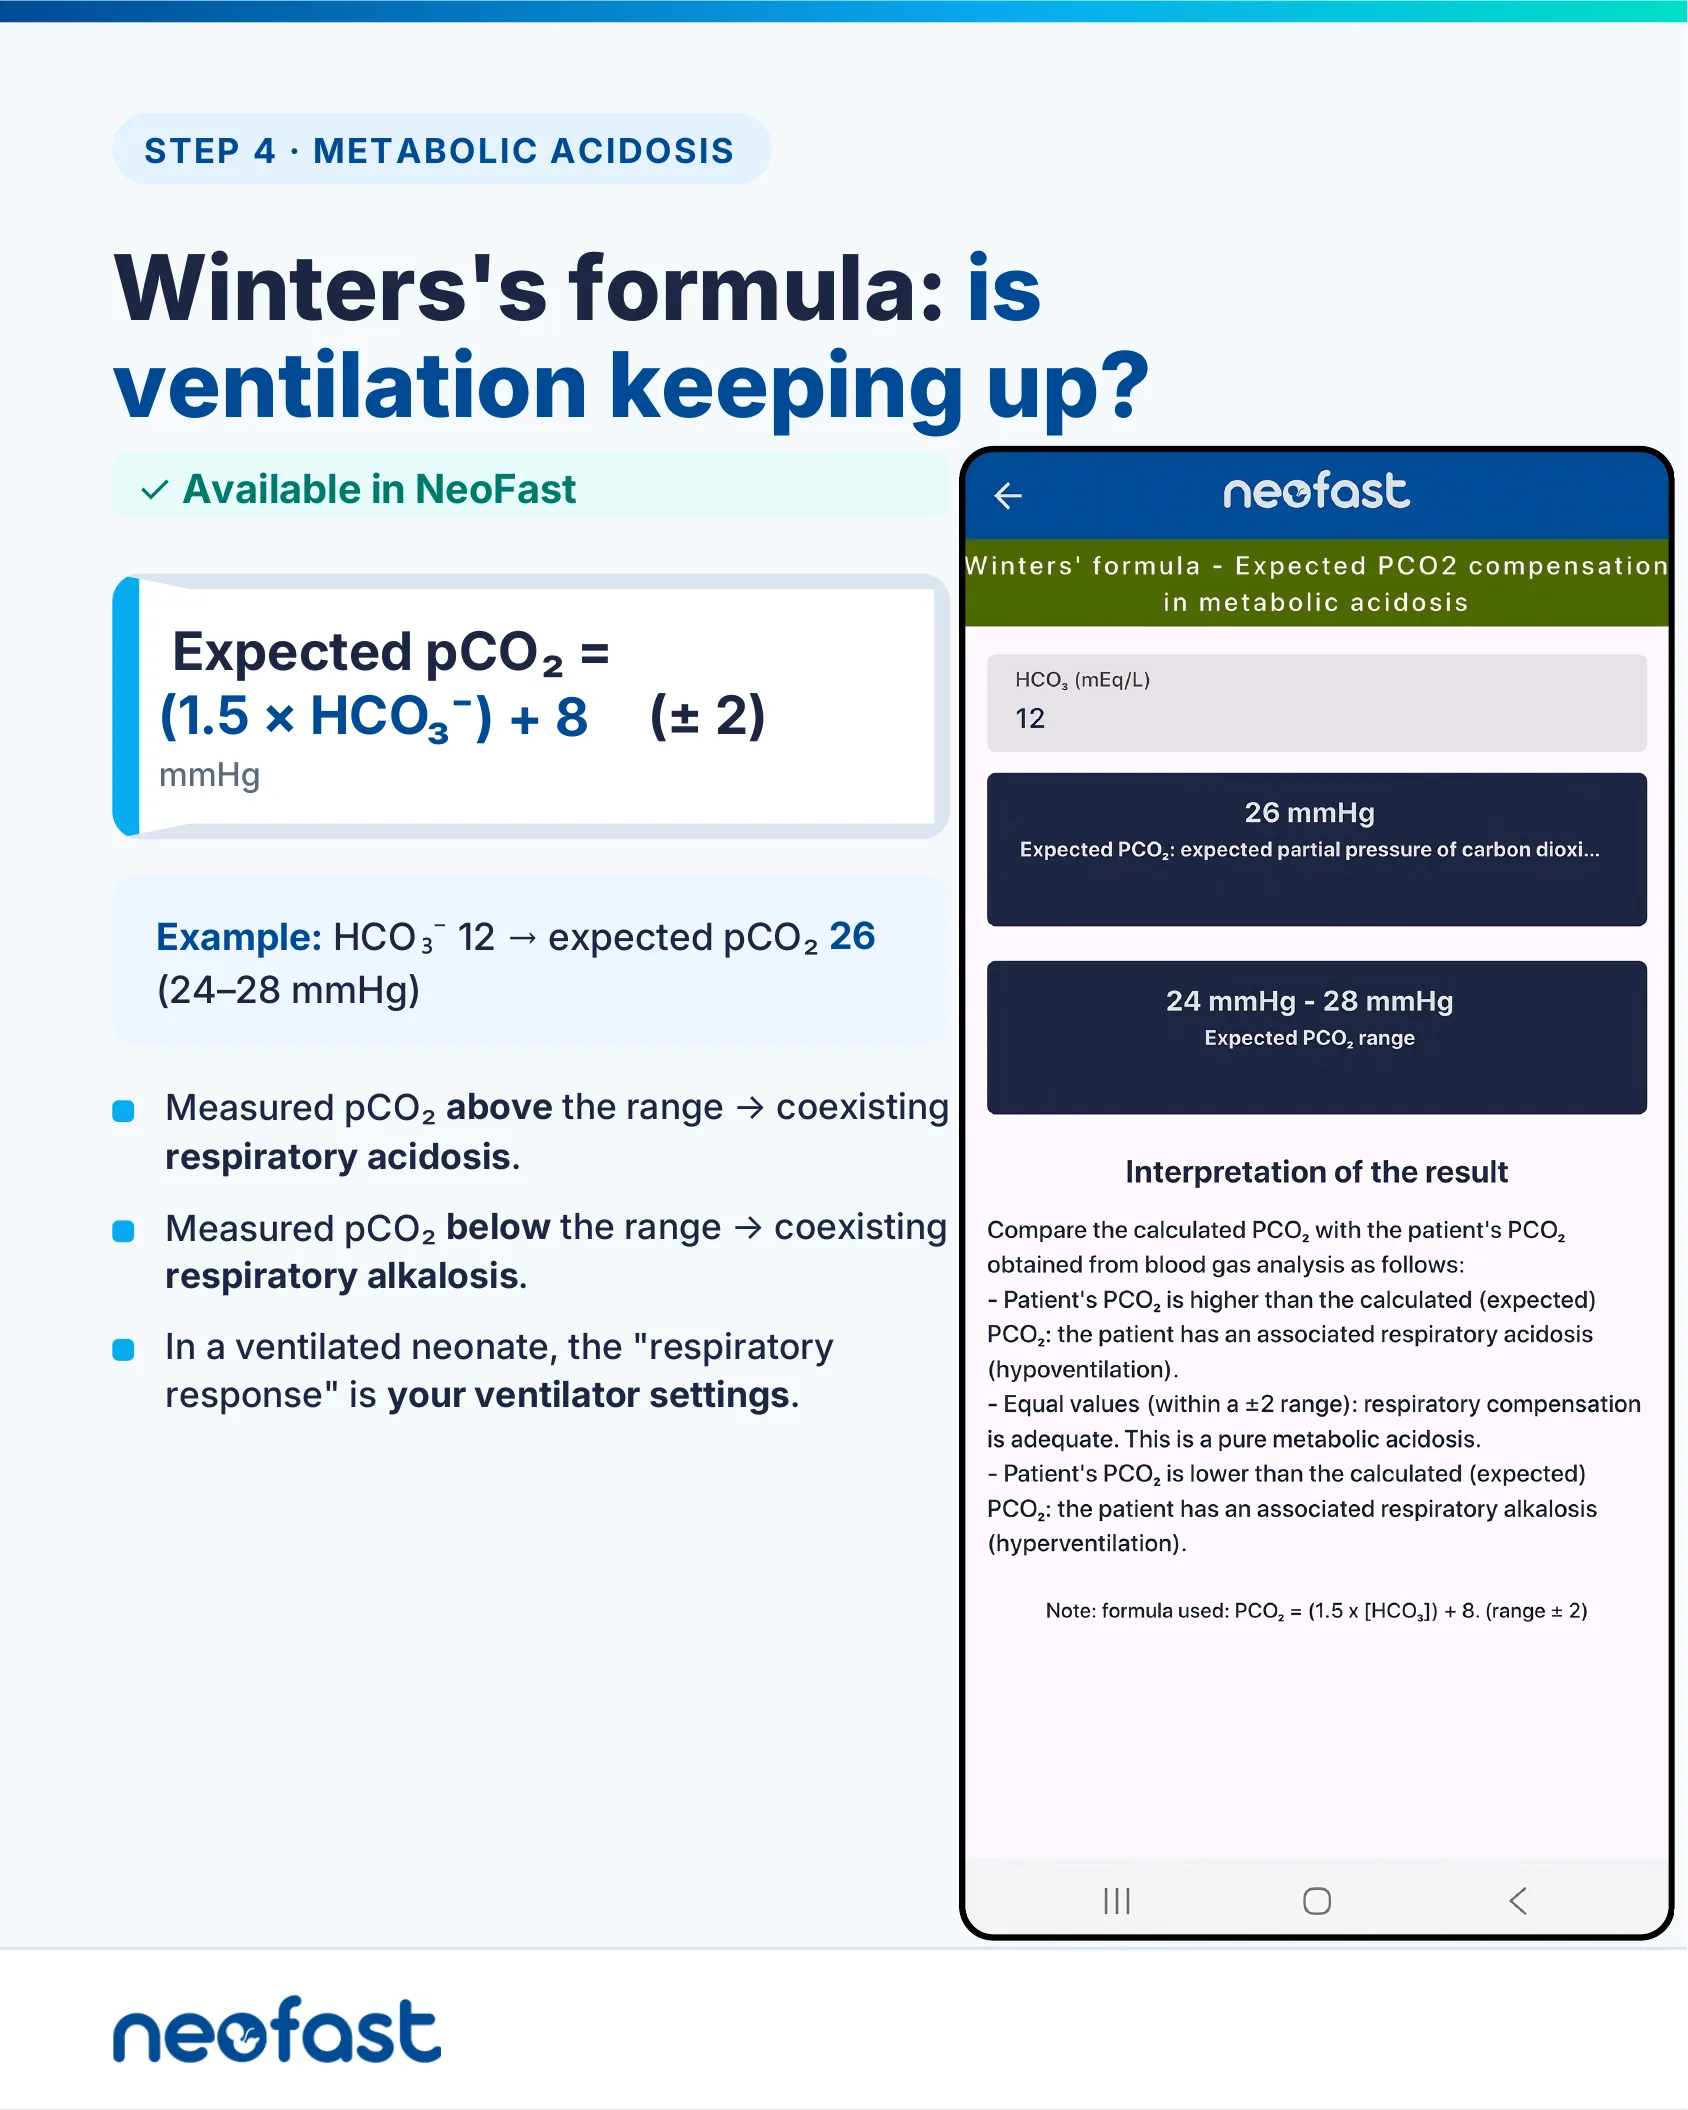
Expected pCO₂ = (1.5 × HCO₃⁻) + 8 (± 2) mmHg
Example: HCO₃⁻ 12 → expected pCO₂ 26 (24–28 mmHg)
- Measured pCO₂ above the range → coexisting respiratory acidosis.
- Measured pCO₂ below the range → coexisting respiratory alkalosis.
- In a ventilated neonate, the “respiratory response” is your ventilator settings.
App example: Winters’ formula – Expected PCO2 compensation in metabolic acidosis. HCO₃ (mEq/L): 12. Expected PCO₂: 26 mmHg. Expected PCO₂ range: 24 mmHg – 28 mmHg.
Interpretation of the result: Compare the calculated PCO₂ with the patient’s PCO₂ obtained from blood gas analysis as follows: Patient’s PCO₂ is higher than the calculated (expected) PCO₂: the patient has an associated respiratory acidosis (hypoventilation). Equal values (within a ±2 range): respiratory compensation is adequate. This is a pure metabolic acidosis. Patient’s PCO₂ is lower than the calculated (expected) PCO₂: the patient has an associated respiratory alkalosis (hyperventilation).
Note: formula used: PCO₂ = (1.5 x [HCO₃]) + 8. (range ± 2)
Anion gap: use the neonatal range
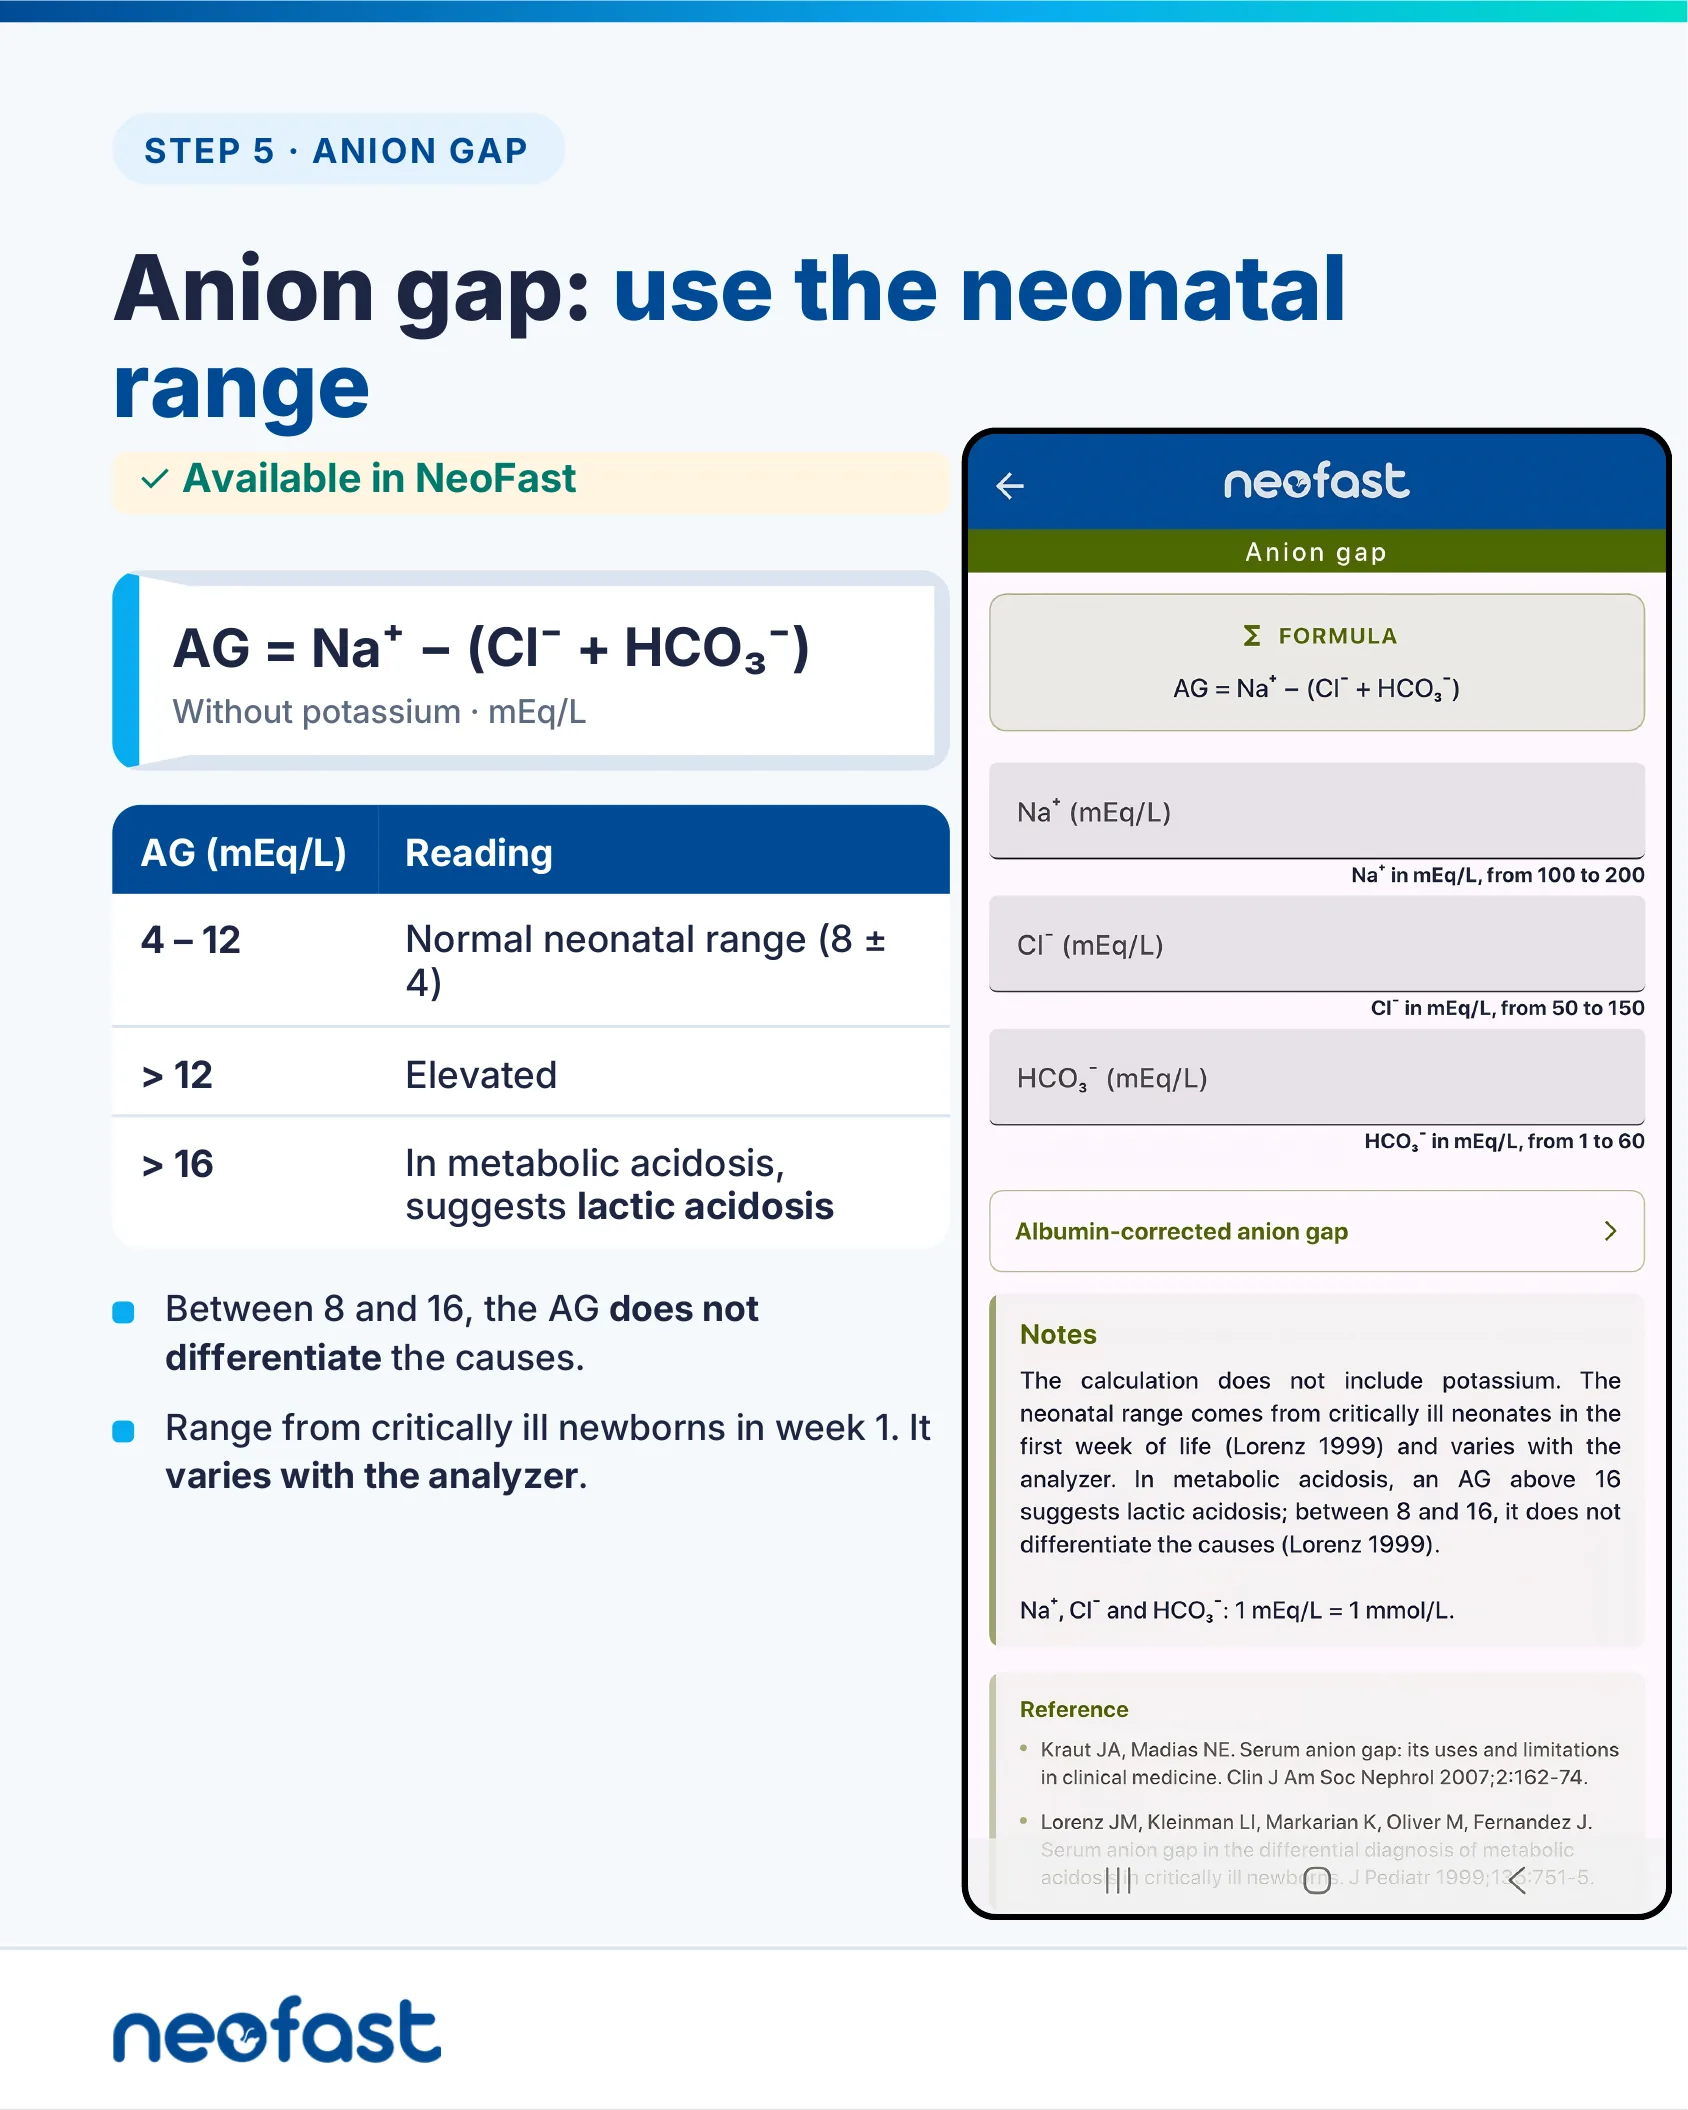
Anion gap: use the neonatal range
✓ Available in NeoFast
AG = Na⁺ − (Cl⁻ + HCO₃⁻)
Without potassium · mEq/L
| AG (mEq/L) | Reading |
|---|---|
| 4 – 12 | Normal neonatal range (8 ± 4) |
| > 12 | Elevated |
| > 16 | In metabolic acidosis, suggests lactic acidosis |
- Between 8 and 16, the AG does not differentiate the causes.
- Range from critically ill newborns in week 1. It varies with the analyzer.
App screen: Anion gap
Formula: AG = Na⁺ − (Cl⁻ + HCO₃⁻)
- Na⁺ (mEq/L) — from 100 to 200
- Cl⁻ (mEq/L) — from 50 to 150
- HCO₃⁻ (mEq/L) — from 1 to 60
Link: Albumin-corrected anion gap
Notes: The calculation does not include potassium. The neonatal range comes from critically ill neonates in the first week of life (Lorenz 1999) and varies with the analyzer. In metabolic acidosis, an AG above 16 suggests lactic acidosis; between 8 and 16, it does not differentiate the causes (Lorenz 1999).
Na⁺, Cl⁻ and HCO₃⁻: 1 mEq/L = 1 mmol/L.
Metabolic alkalosis: often iatrogenic
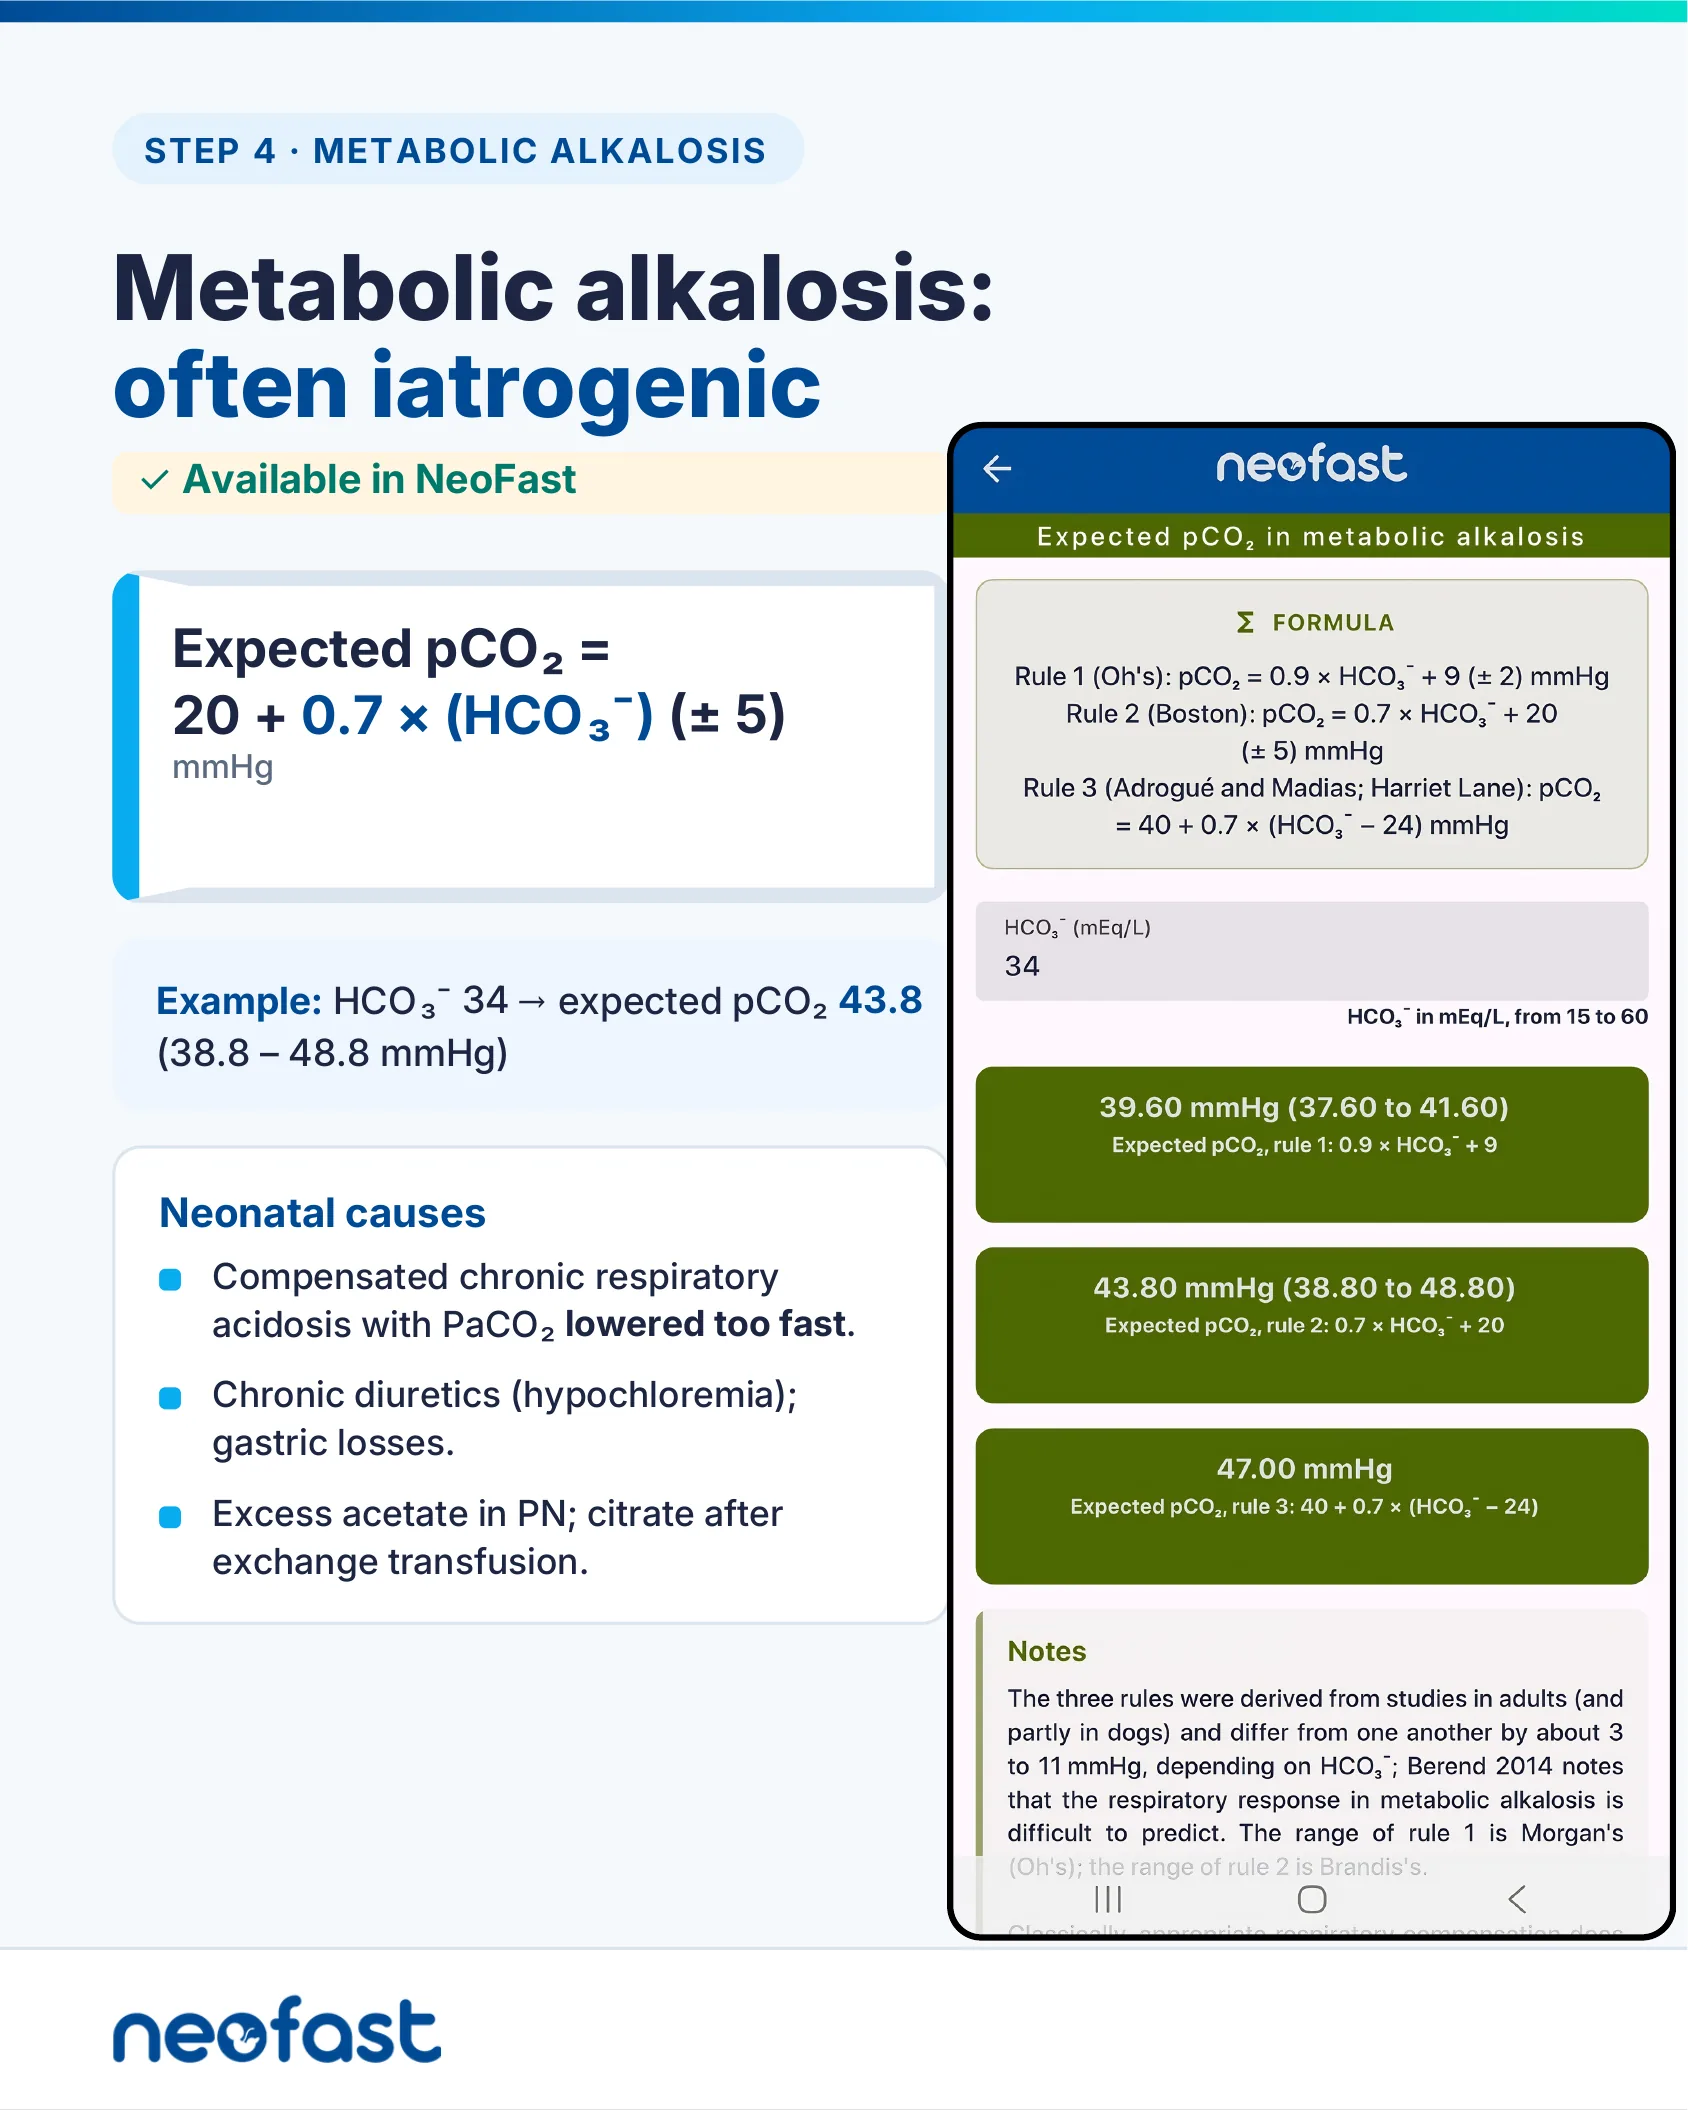
Metabolic alkalosis: often iatrogenic
✓ Available in NeoFast
Expected pCO₂ = 20 + 0.7 × (HCO₃⁻) (± 5)
mmHg
Example: HCO₃⁻ 34 → expected pCO₂ 43.8 (38.8 – 48.8 mmHg)
Neonatal causes
- Compensated chronic respiratory acidosis with PaCO₂ lowered too fast.
- Chronic diuretics (hypochloremia); gastric losses.
- Excess acetate in PN; citrate after exchange transfusion.
App screen: Expected pCO₂ in metabolic alkalosis
Formula:
- Rule 1 (Oh’s): pCO₂ = 0.9 × HCO₃⁻ + 9 (± 2) mmHg
- Rule 2 (Boston): pCO₂ = 0.7 × HCO₃⁻ + 20 (± 5) mmHg
- Rule 3 (Adrogué and Madias; Harriet Lane): pCO₂ = 40 + 0.7 × (HCO₃⁻ − 24) mmHg
HCO₃⁻ (mEq/L): 34
- 39.60 mmHg (37.60 to 41.60) — Expected pCO₂, rule 1: 0.9 × HCO₃⁻ + 9
- 43.80 mmHg (38.80 to 48.80) — Expected pCO₂, rule 2: 0.7 × HCO₃⁻ + 20
- 47.00 mmHg — Expected pCO₂, rule 3: 40 + 0.7 × (HCO₃⁻ − 24)
Notes: The three rules were derived from studies in adults (and partly in dogs) and differ from one another by about 3 to 11 mmHg, depending on HCO₃⁻; Berend 2014 notes that the respiratory response in metabolic alkalosis is difficult to predict. The range of rule 1 is Morgan’s (Oh’s); the range of rule 2 is Brandis’s. Classically, appropriate respiratory compensation does…
Respiratory acidosis: acute or chronic?
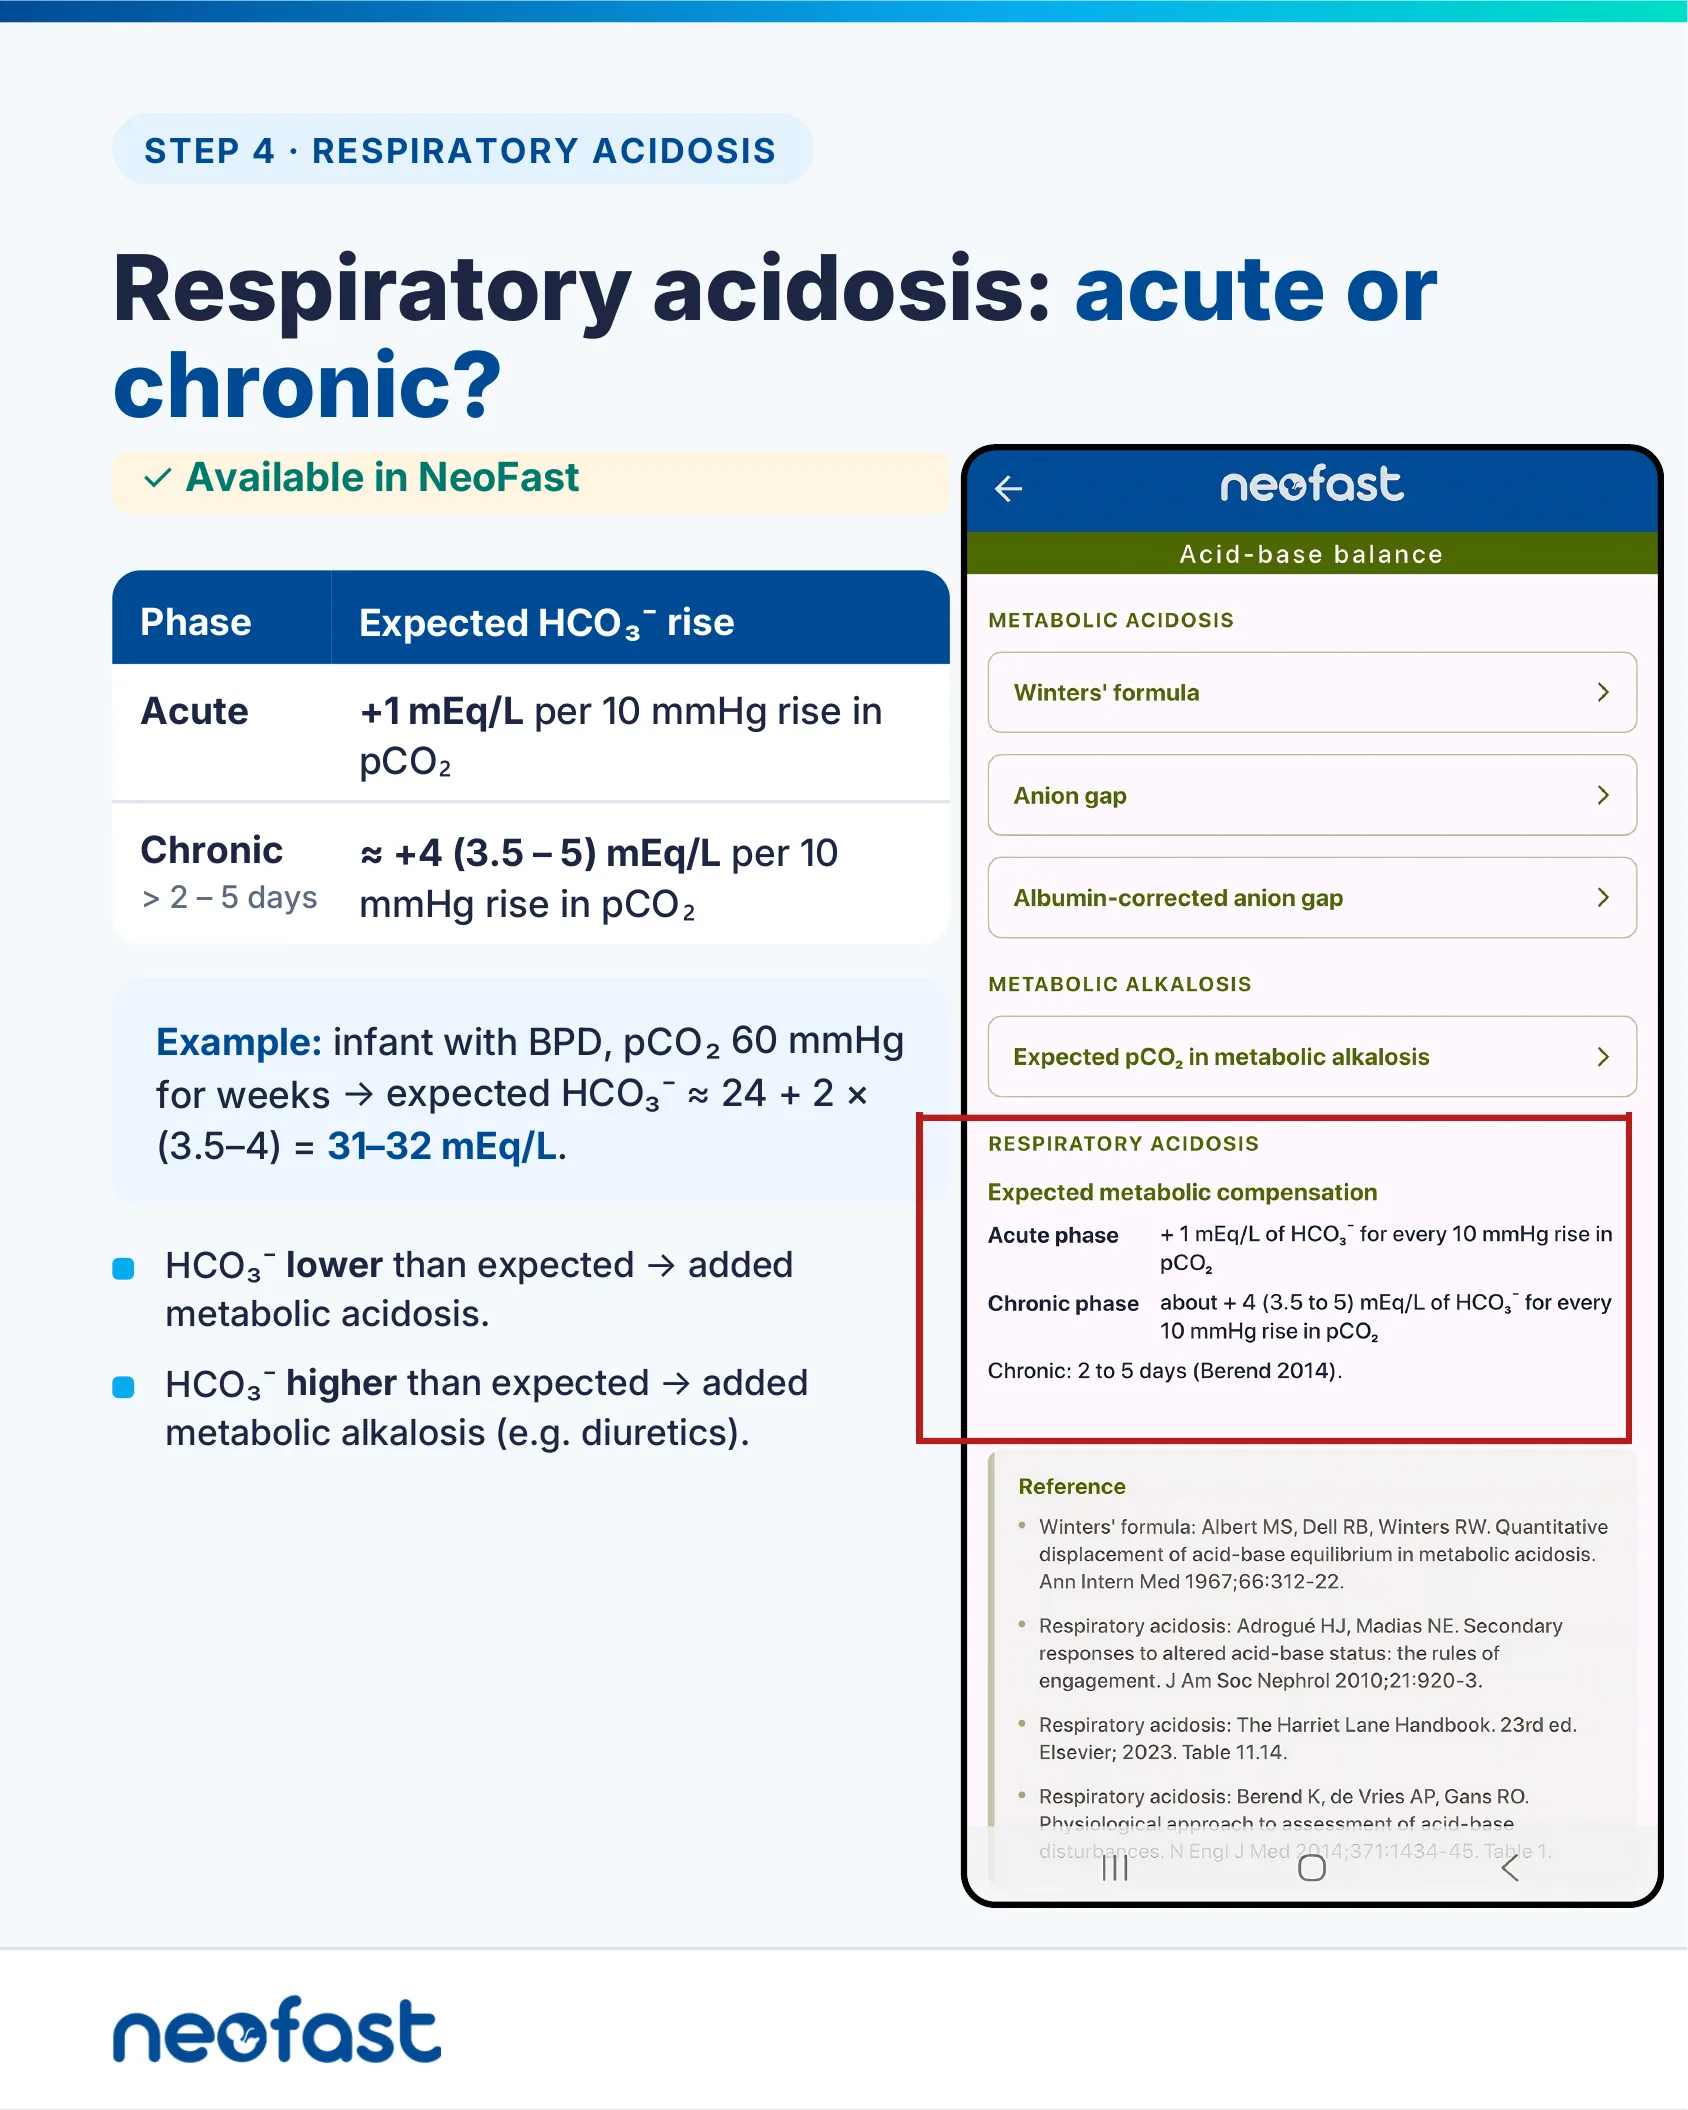
Respiratory acidosis: acute or chronic?
✓ Available in NeoFast
| Phase | Expected HCO₃⁻ rise |
|---|---|
| Acute | +1 mEq/L per 10 mmHg rise in pCO₂ |
| Chronic > 2 – 5 days | ≈ +4 (3.5 – 5) mEq/L per 10 mmHg rise in pCO₂ |
Example: infant with BPD, pCO₂ 60 mmHg for weeks → expected HCO₃⁻ ≈ 24 + 2 × (3.5–4) = 31–32 mEq/L.
- HCO₃⁻ lower than expected → added metabolic acidosis.
- HCO₃⁻ higher than expected → added metabolic alkalosis (e.g. diuretics).
App screen: Acid-base balance
Metabolic acidosis
- Winters’ formula
- Anion gap
- Albumin-corrected anion gap
Metabolic alkalosis
- Expected pCO₂ in metabolic alkalosis
Respiratory acidosis — Expected metabolic compensation
- Acute phase: +1 mEq/L of HCO₃⁻ for every 10 mmHg rise in pCO₂
- Chronic phase: about +4 (3.5 to 5) mEq/L of HCO₃⁻ for every 10 mmHg rise in pCO₂
- Chronic: 2 to 5 days (Berend 2014).
Sodium bicarbonate: rarely, and slowly
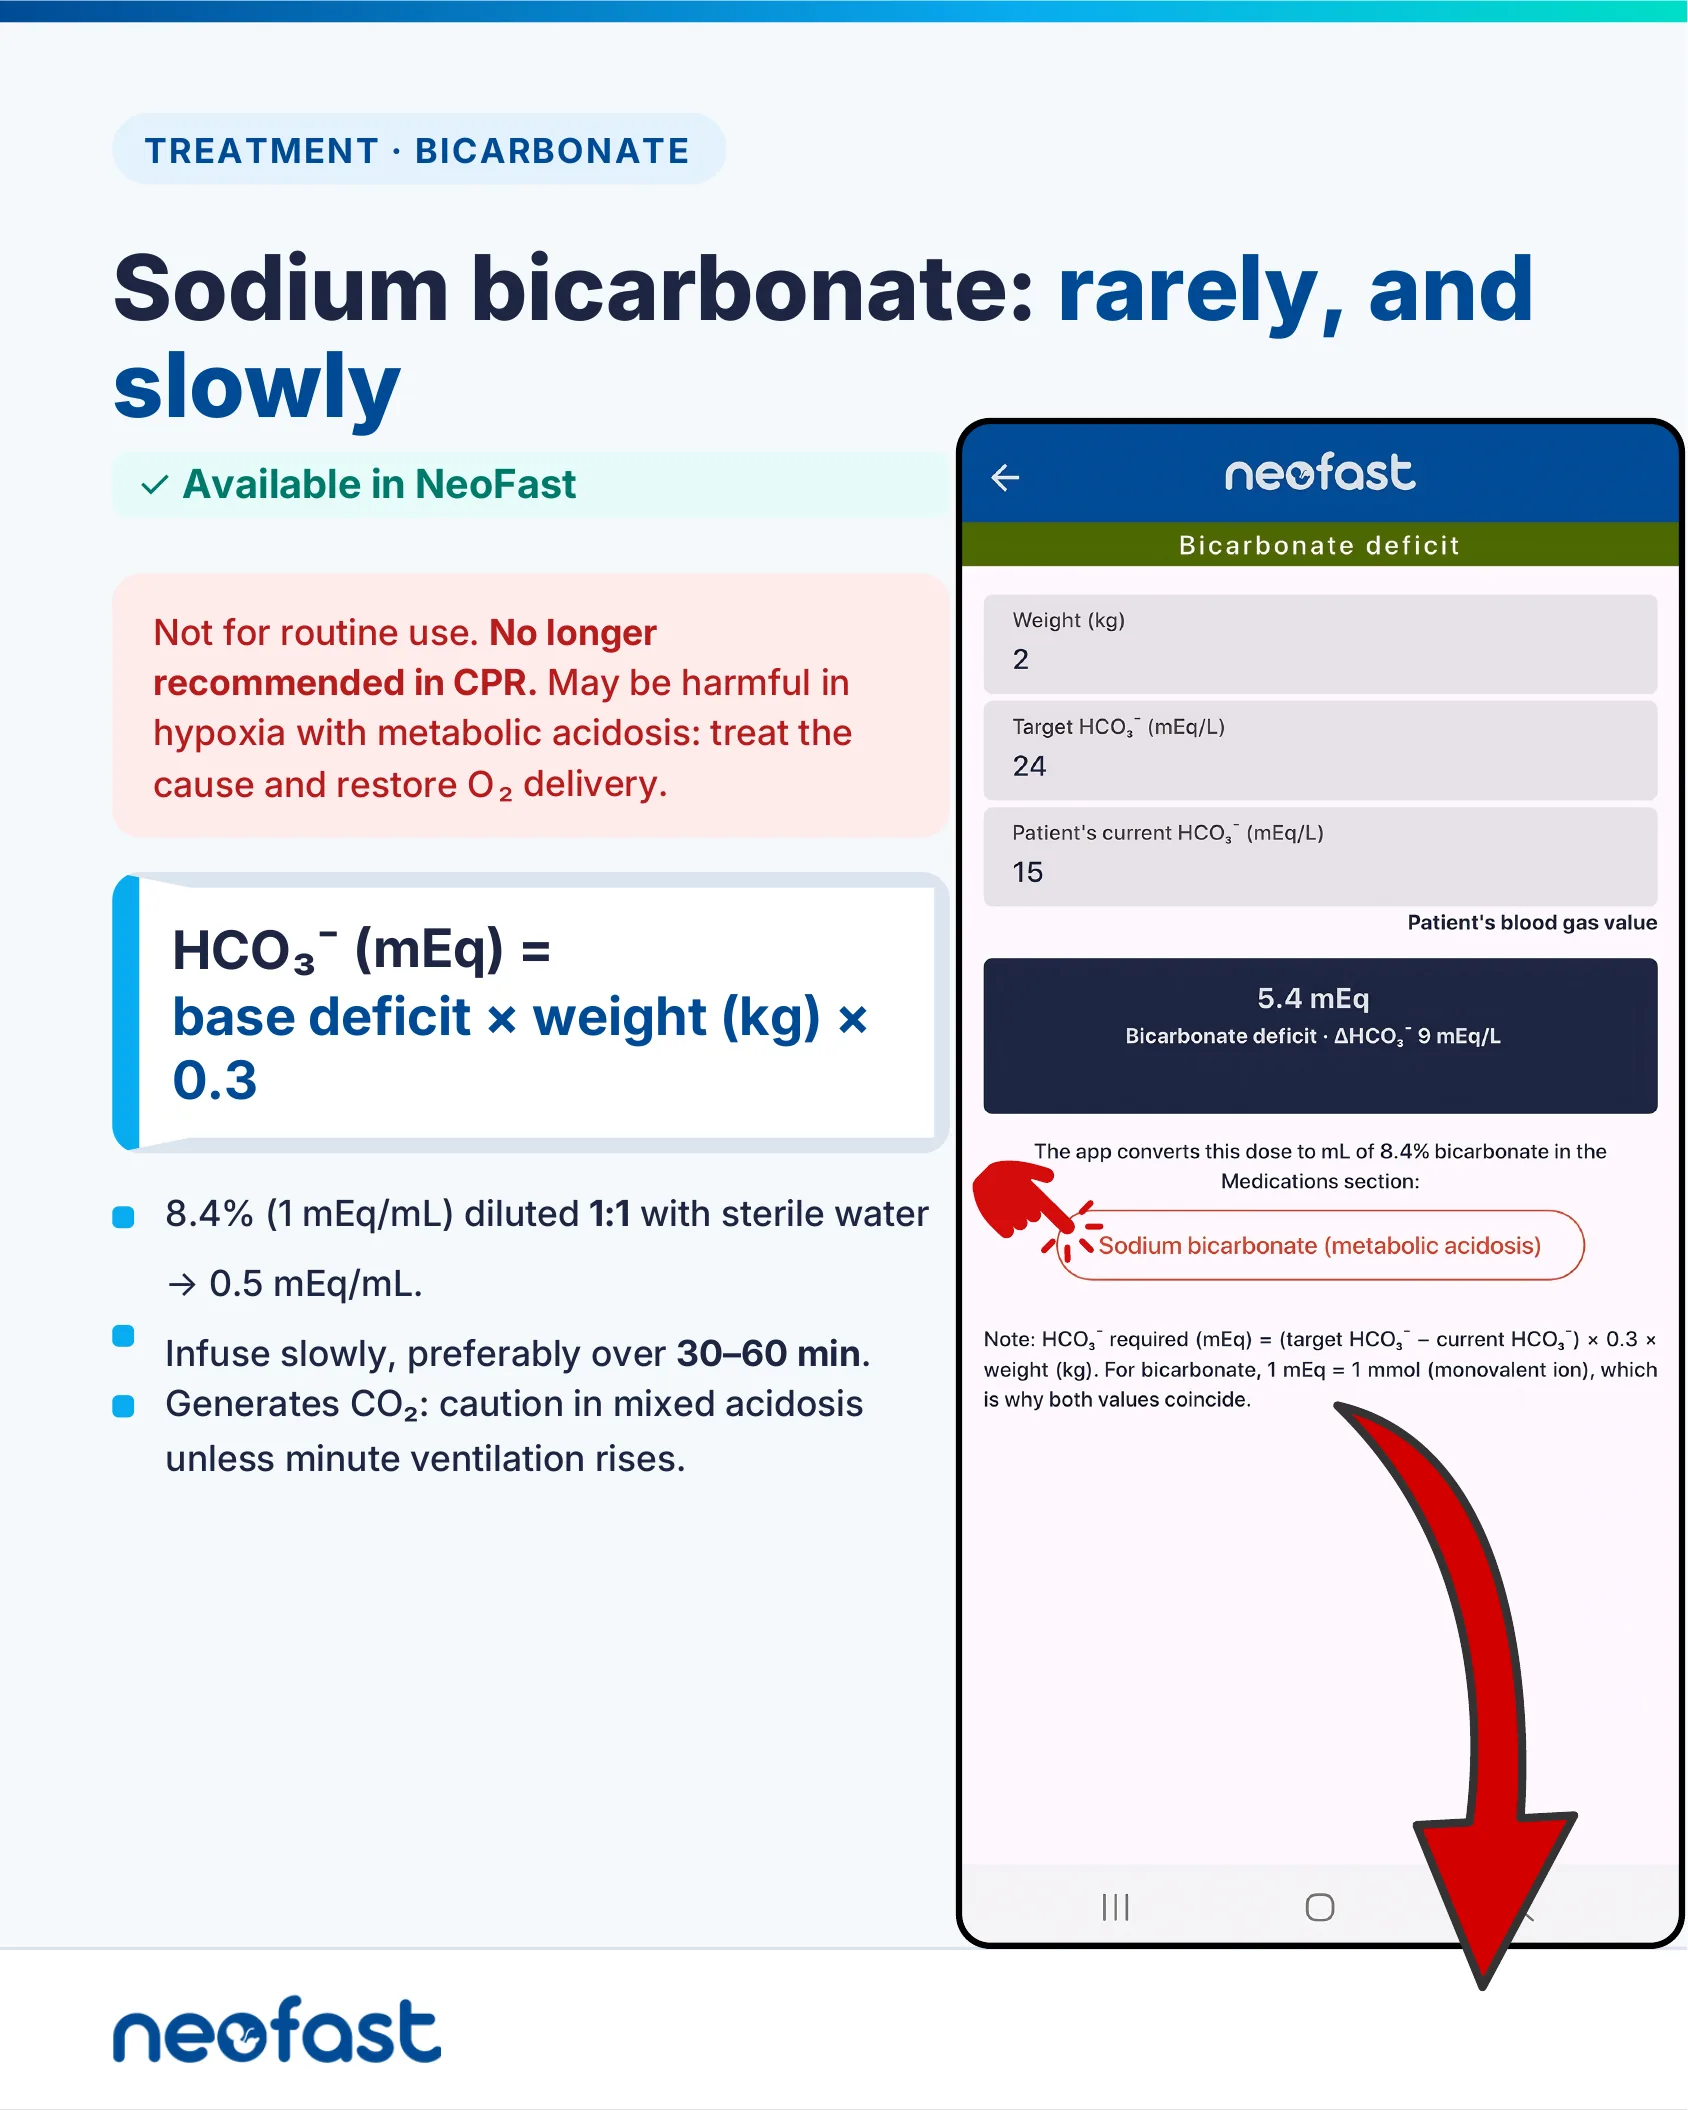
Sodium bicarbonate: rarely, and slowly
✓ Available in NeoFast
Not for routine use. No longer recommended in CPR. May be harmful in hypoxia with metabolic acidosis: treat the cause and restore O₂ delivery.
HCO₃⁻ (mEq) = base deficit × weight (kg) × 0.3
- 8.4% (1 mEq/mL) diluted 1:1 with sterile water → 0.5 mEq/mL.
- Infuse slowly, preferably over 30–60 min.
- Generates CO₂: caution in mixed acidosis unless minute ventilation rises.
App screen: Bicarbonate deficit
- Weight (kg): 2
- Target HCO₃⁻ (mEq/L): 24
- Patient’s current HCO₃⁻ (mEq/L): 15
Result: 5.4 mEq — Bicarbonate deficit · ΔHCO₃⁻ 9 mEq/L
The app converts this dose to mL of 8.4% bicarbonate in the Medications section: Sodium bicarbonate (metabolic acidosis).
Note: HCO₃⁻ required (mEq) = (target HCO₃⁻ − current HCO₃⁻) × 0.3 × weight (kg). For bicarbonate, 1 mEq = 1 mmol (monovalent ion), which is why both values coincide.
Sodium bicarbonate dosing and infusion calculation
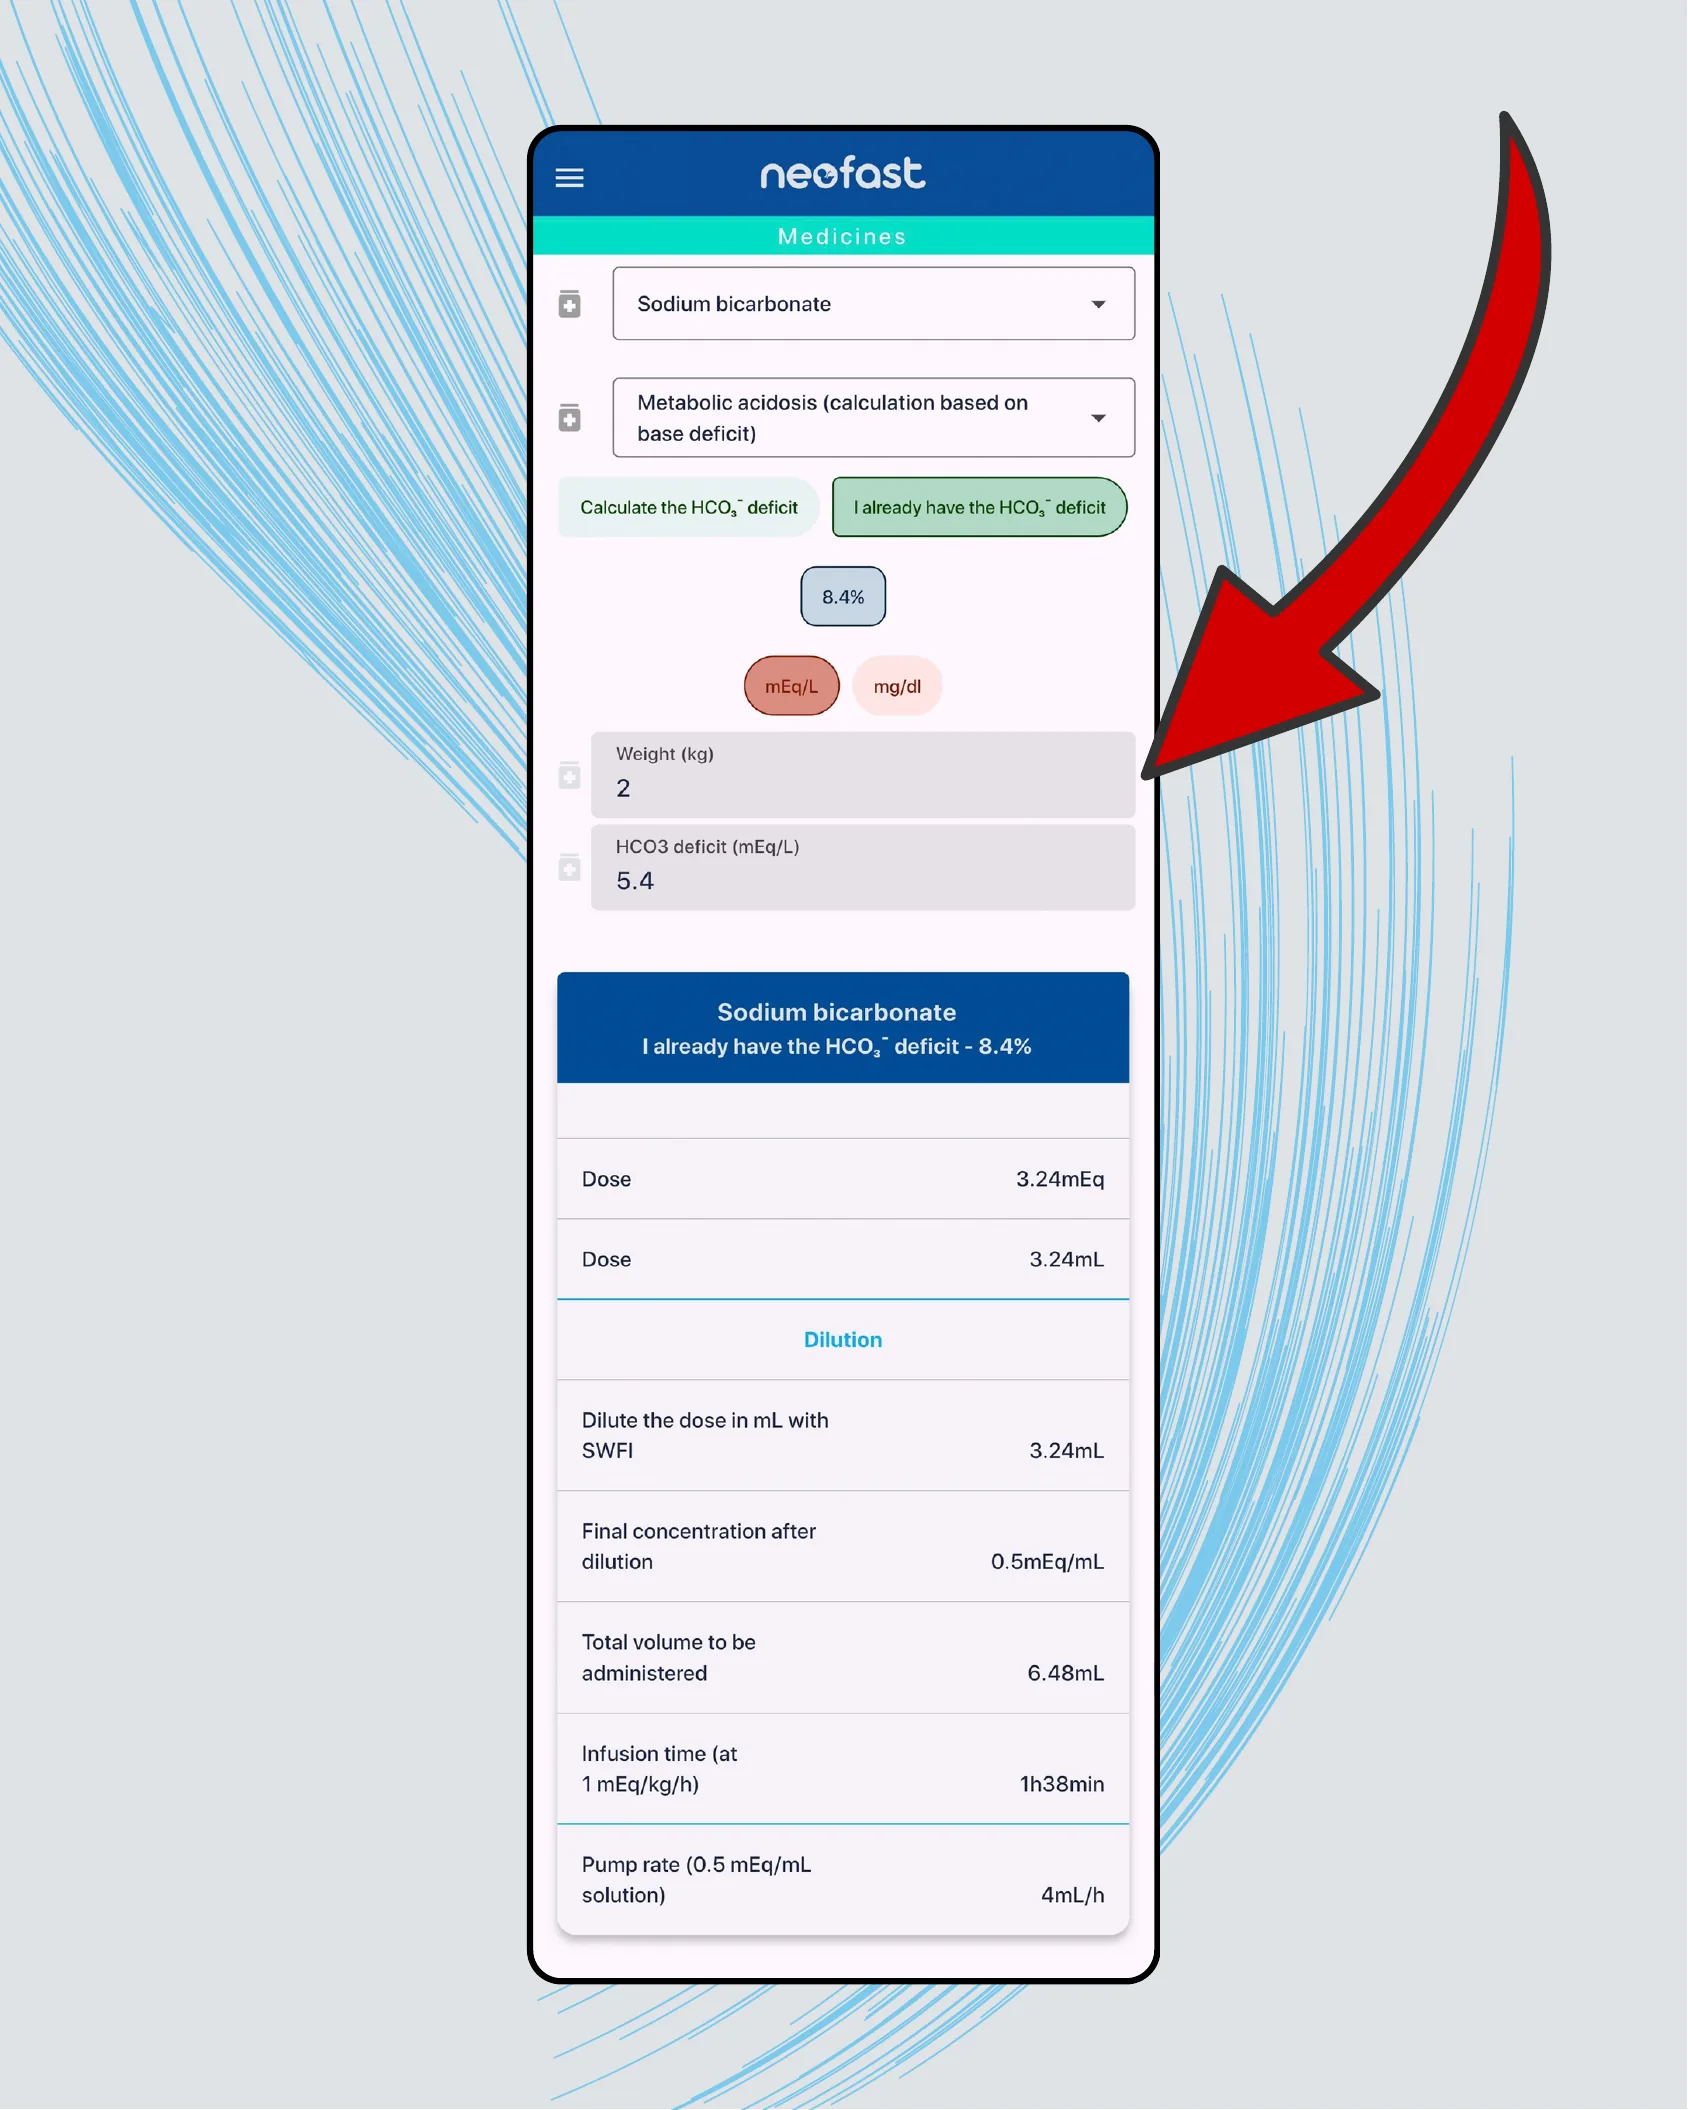
App screen: Medicines
- Sodium bicarbonate
- Metabolic acidosis (calculation based on base deficit)
Options: Calculate the HCO₃⁻ deficit | I already have the HCO₃⁻ deficit
Concentration: 8.4% | Units: mEq/L | mg/dl
- Weight (kg): 2
- HCO3 deficit (mEq/L): 5.4
Sodium bicarbonate — I already have the HCO₃⁻ deficit – 8.4%
| Dose | 3.24 mEq |
| Dose | 3.24 mL |
Dilution
| Dilute the dose in mL with SWFI | 3.24 mL |
| Final concentration after dilution | 0.5 mEq/mL |
| Total volume to be administered | 6.48 mL |
| Infusion time (at 1 mEq/kg/h) | 1h38min |
| Pump rate (0.5 mEq/mL solution) | 4 mL/h |
PaO2 is not oxygen content
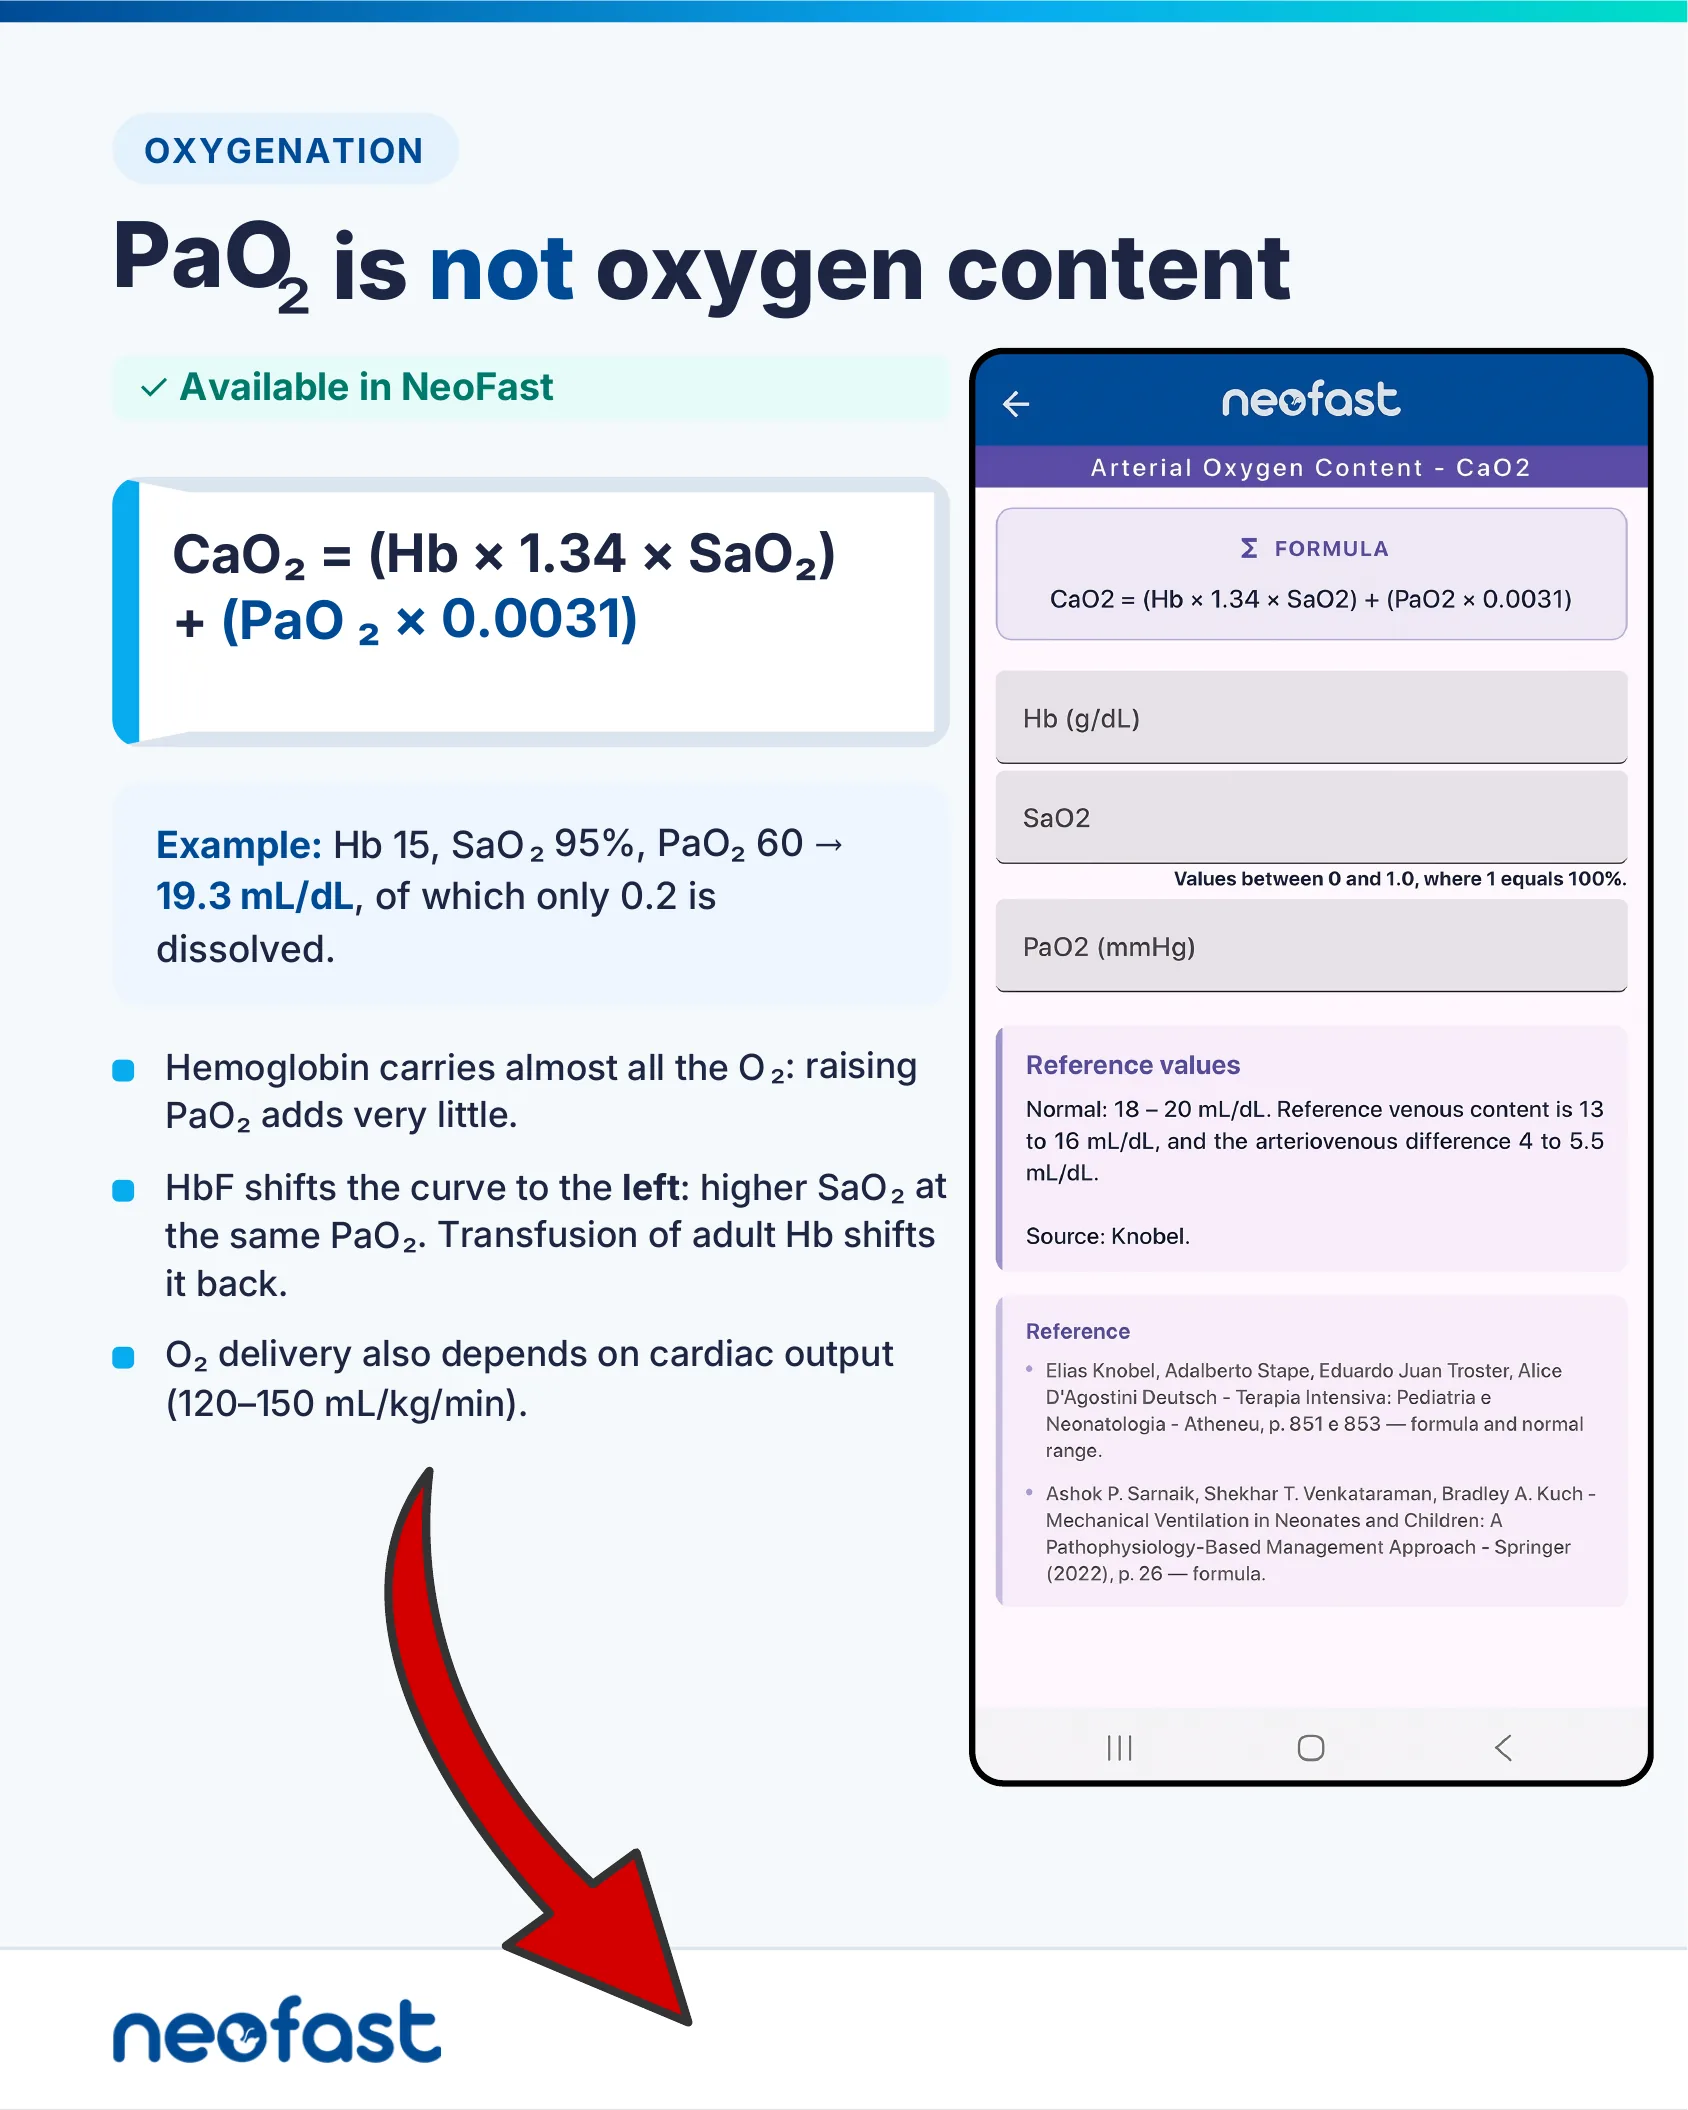
PaO₂ is not oxygen content
✓ Available in NeoFast
CaO₂ = (Hb × 1.34 × SaO₂) + (PaO₂ × 0.0031)
Example: Hb 15, SaO₂ 95%, PaO₂ 60 → 19.3 mL/dL, of which only 0.2 is dissolved.
- Hemoglobin carries almost all the O₂: raising PaO₂ adds very little.
- HbF shifts the curve to the left: higher SaO₂ at the same PaO₂. Transfusion of adult Hb shifts it back.
- O₂ delivery also depends on cardiac output (120–150 mL/kg/min).
App screen: Arterial Oxygen Content – CaO2
Formula: CaO2 = (Hb × 1.34 × SaO2) + (PaO2 × 0.0031)
- Hb (g/dL)
- SaO2 — Values between 0 and 1.0, where 1 equals 100%.
- PaO2 (mmHg)
Reference values: Normal: 18 – 20 mL/dL. Reference venous content is 13 to 16 mL/dL, and the arteriovenous difference 4 to 5.5 mL/dL.
Source: Knobel.
Arterial oxygen content calculation result
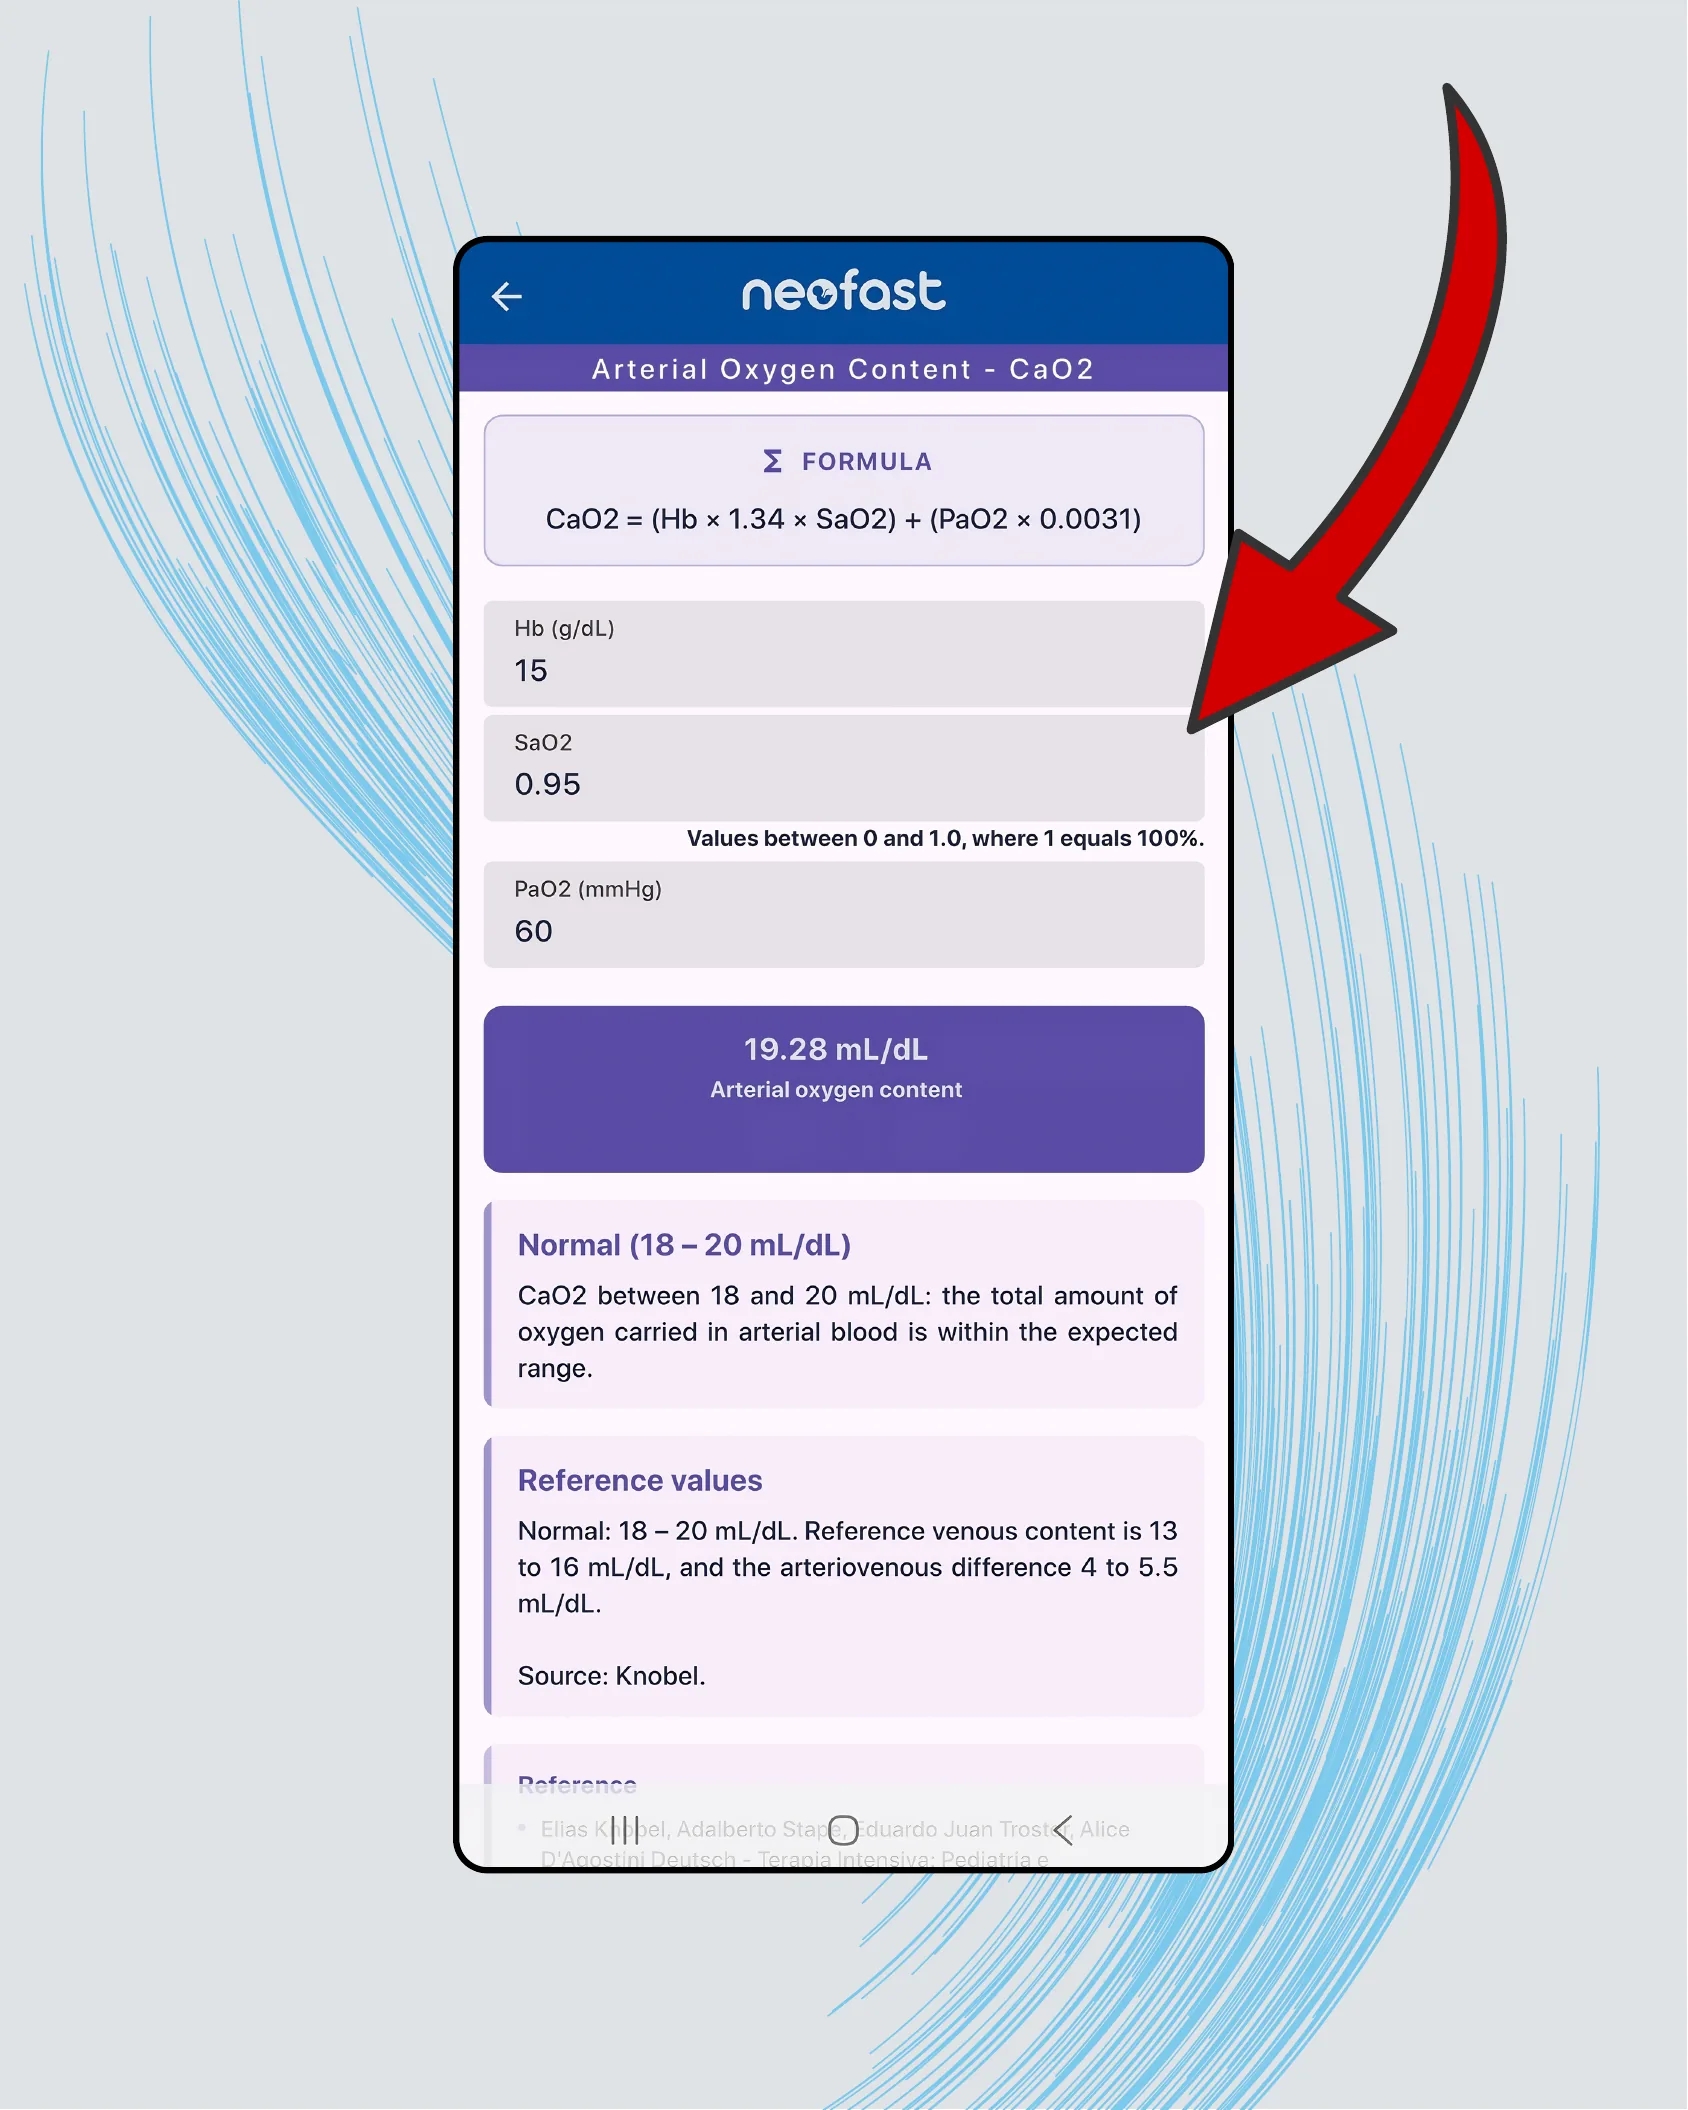
App screen: Arterial Oxygen Content – CaO2
Formula: CaO2 = (Hb × 1.34 × SaO2) + (PaO2 × 0.0031)
- Hb (g/dL): 15
- SaO2: 0.95 (Values between 0 and 1.0, where 1 equals 100%.)
- PaO2 (mmHg): 60
Result: 19.28 mL/dL — Arterial oxygen content
Normal (18 – 20 mL/dL): CaO2 between 18 and 20 mL/dL: the total amount of oxygen carried in arterial blood is within the expected range.
Reference values: Normal: 18 – 20 mL/dL. Reference venous content is 13 to 16 mL/dL, and the arteriovenous difference 4 to 5.5 mL/dL.
Source: Knobel.
OI and OSI: severity, with or without a gas
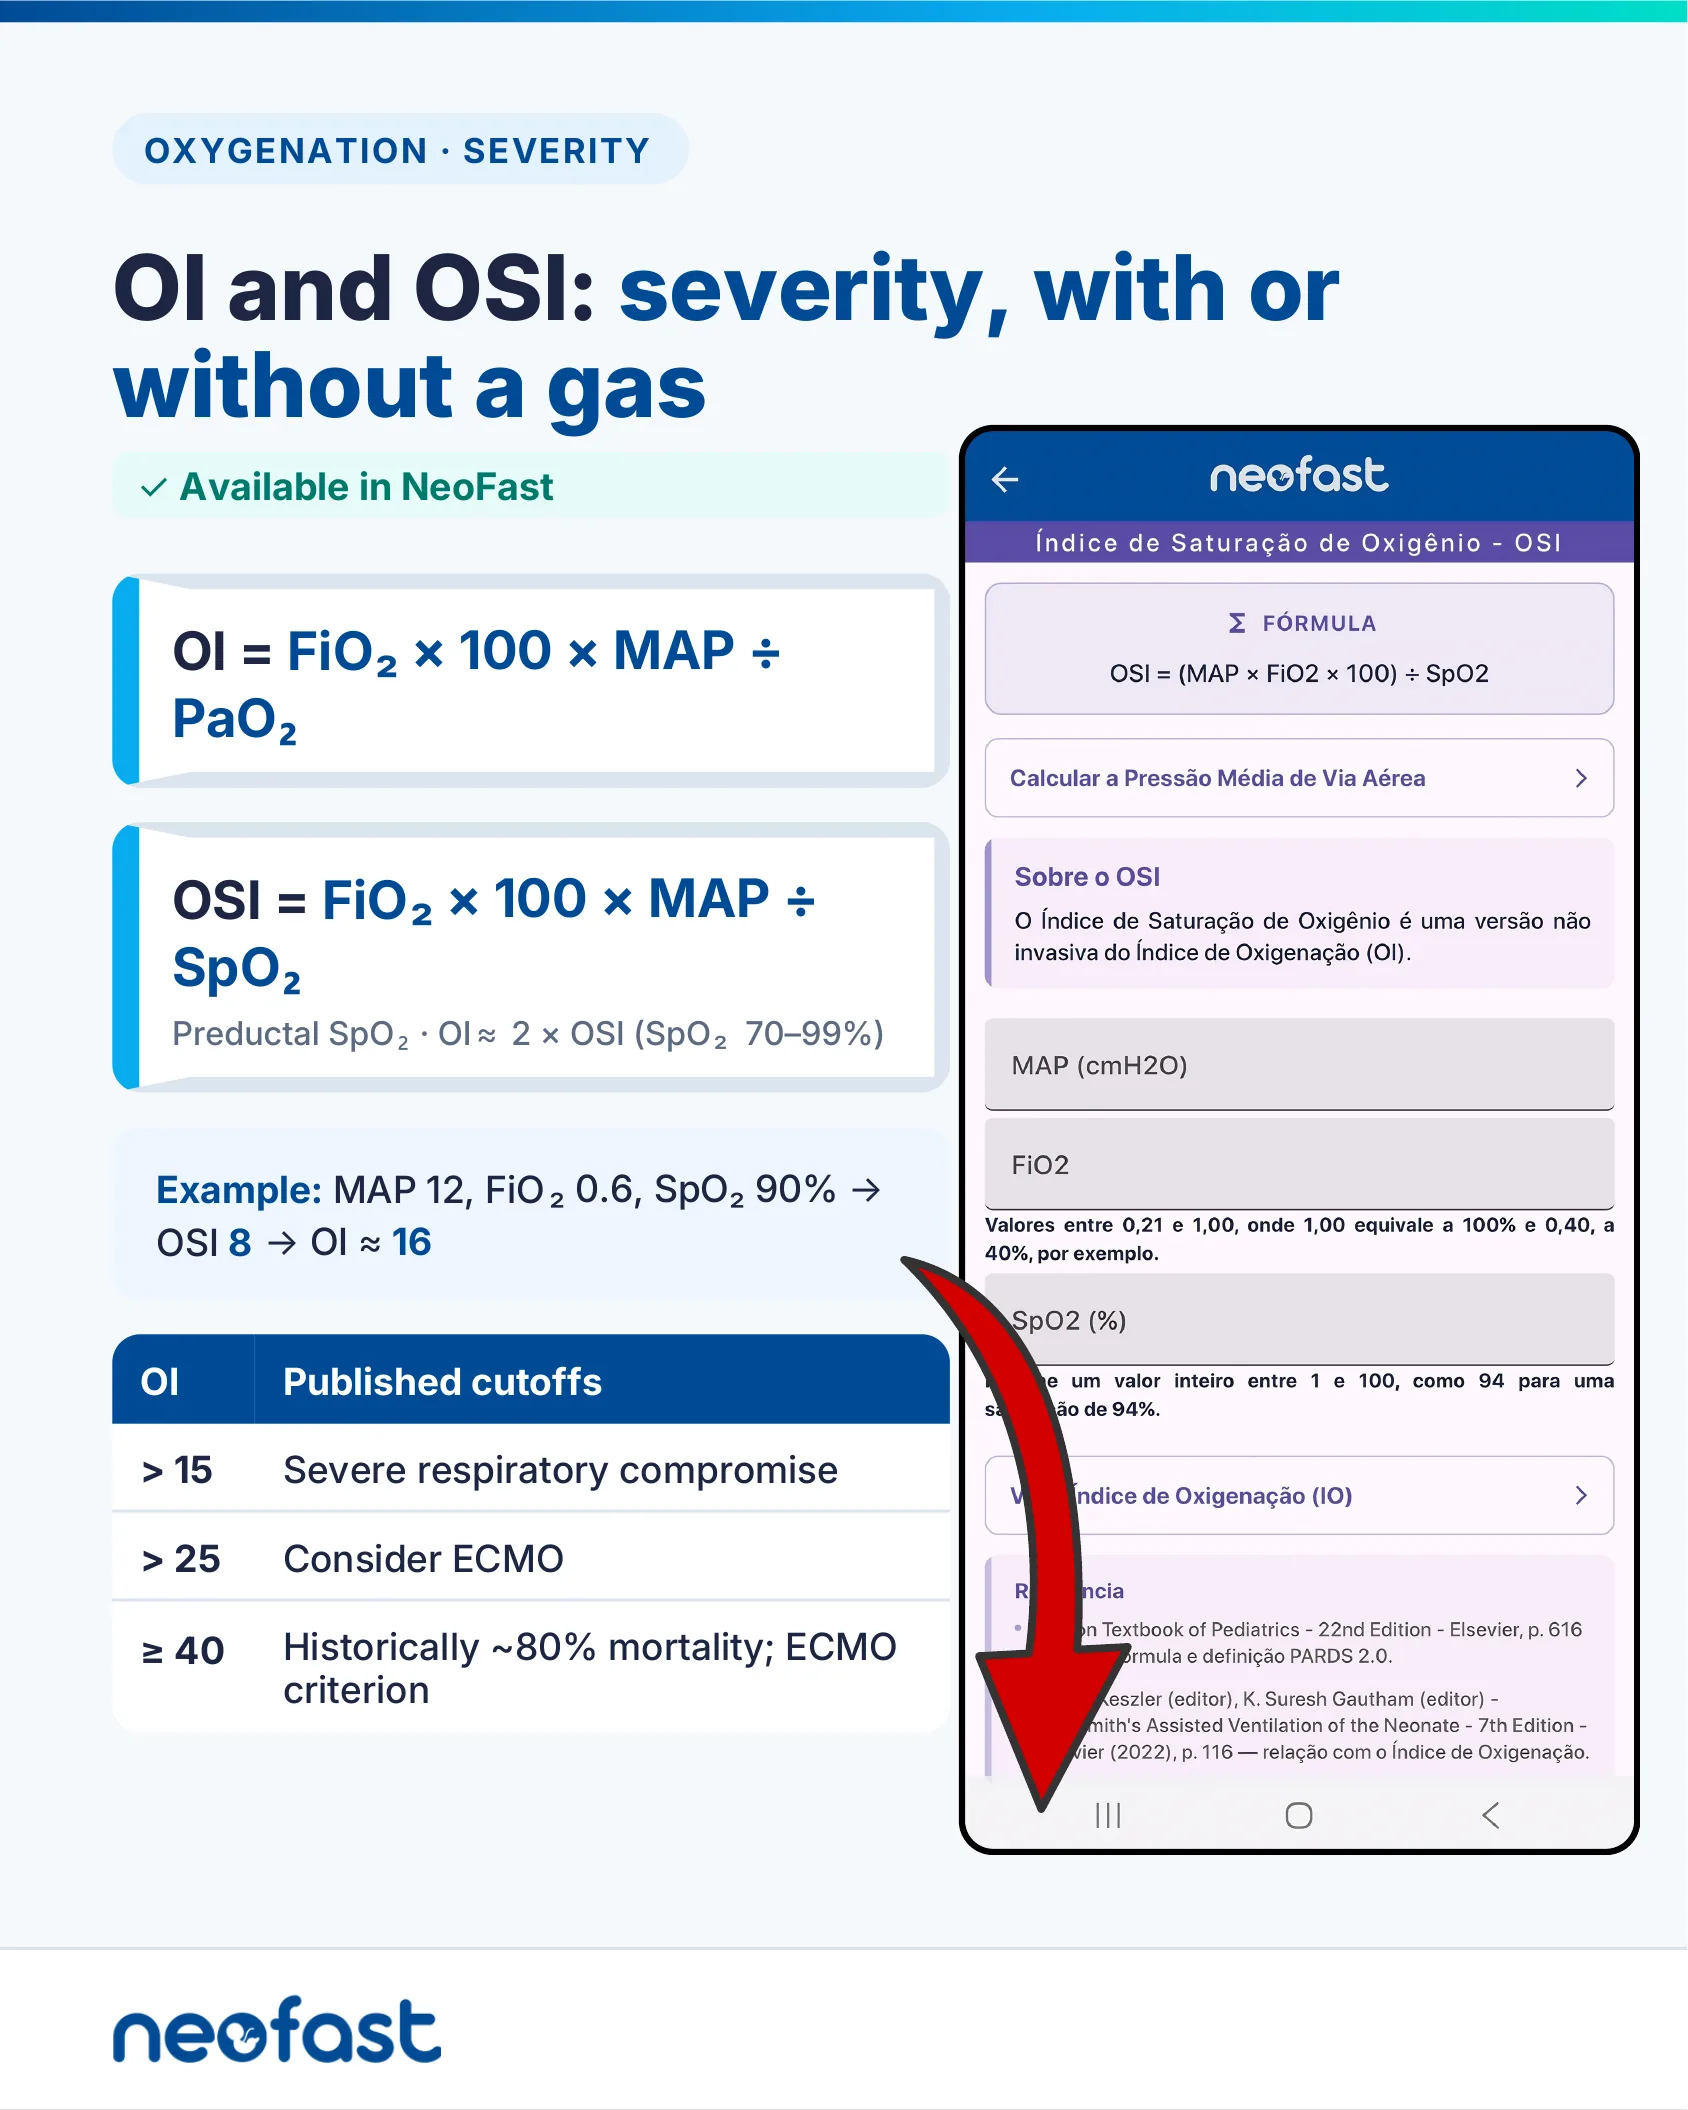
OI and OSI: severity, with or without a gas
✓ Available in NeoFast
OI = FiO₂ × 100 × MAP ÷ PaO₂
OSI = FiO₂ × 100 × MAP ÷ SpO₂
Preductal SpO₂ · OI ≈ 2 × OSI (SpO₂ 70–99%)
Example: MAP 12, FiO₂ 0.6, SpO₂ 90% → OSI 8 → OI ≈ 16
| OI | Published cutoffs |
|---|---|
| > 15 | Severe respiratory compromise |
| > 25 | Consider ECMO |
| ≥ 40 | Historically ~80% mortality; ECMO criterion |
App screen: Índice de Saturação de Oxigênio – OSI
Fórmula: OSI = (MAP × FiO2 × 100) ÷ SpO2
Link: Calcular a Pressão Média de Via Aérea
Sobre o OSI: O Índice de Saturação de Oxigênio é uma versão não invasiva do Índice de Oxigenação (OI).
- MAP (cmH2O)
- FiO2 — Valores entre 0,21 e 1,00, onde 1,00 equivale a 100% e 0,40, a 40%, por exemplo.
- SpO2 (%) — Informe um valor inteiro entre 1 e 100, como 94 para uma saturação de 94%.
Link: Ver Índice de Oxigenação (IO)
Oxygen Saturation Index – OSI
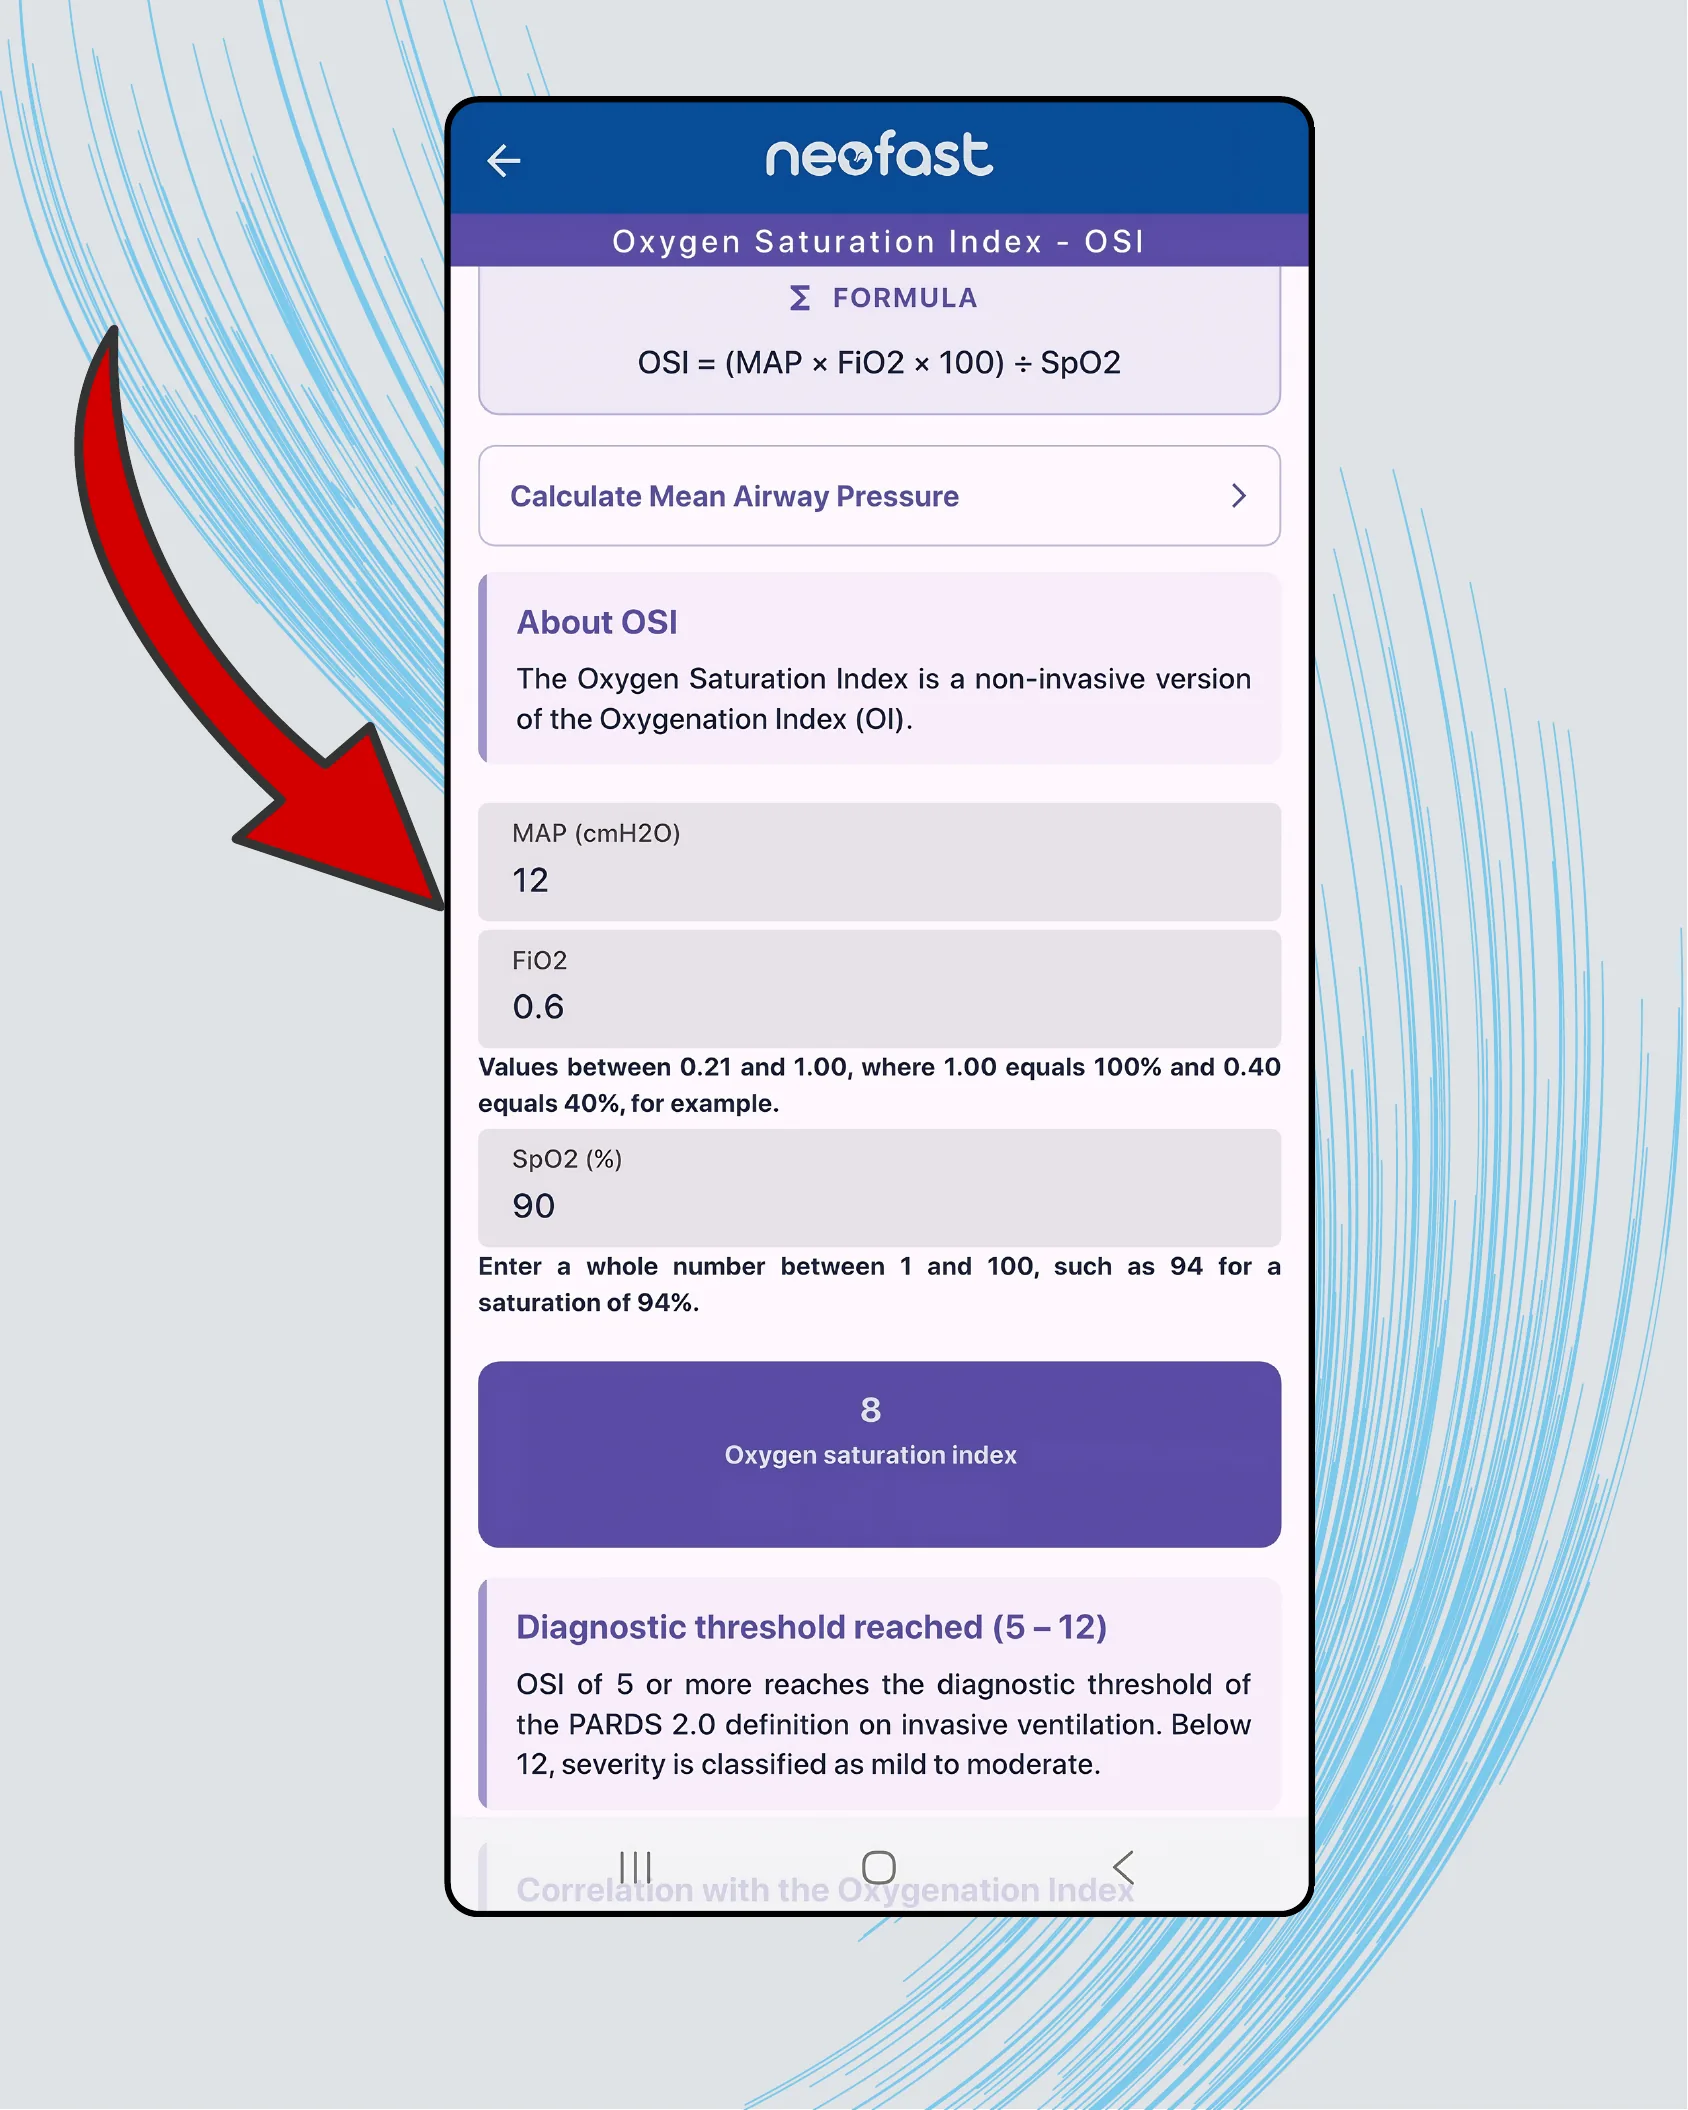
Oxygen Saturation Index – OSI
FORMULA
OSI = (MAP × FiO2 × 100) ÷ SpO2
Calculate Mean Airway Pressure
About OSI
The Oxygen Saturation Index is a non-invasive version of the Oxygenation Index (OI).
- MAP (cmH2O): 12
- FiO2: 0.6 — Values between 0.21 and 1.00, where 1.00 equals 100% and 0.40 equals 40%, for example.
- SpO2 (%): 90 — Enter a whole number between 1 and 100, such as 94 for a saturation of 94%.
Result: 8 — Oxygen saturation index
Diagnostic threshold reached (5 – 12)
OSI of 5 or more reaches the diagnostic threshold of the PARDS 2.0 definition on invasive ventilation. Below 12, severity is classified as mild to moderate.
Correlation with the Oxygenation Index
A–a gradient: compare at the same FiO2
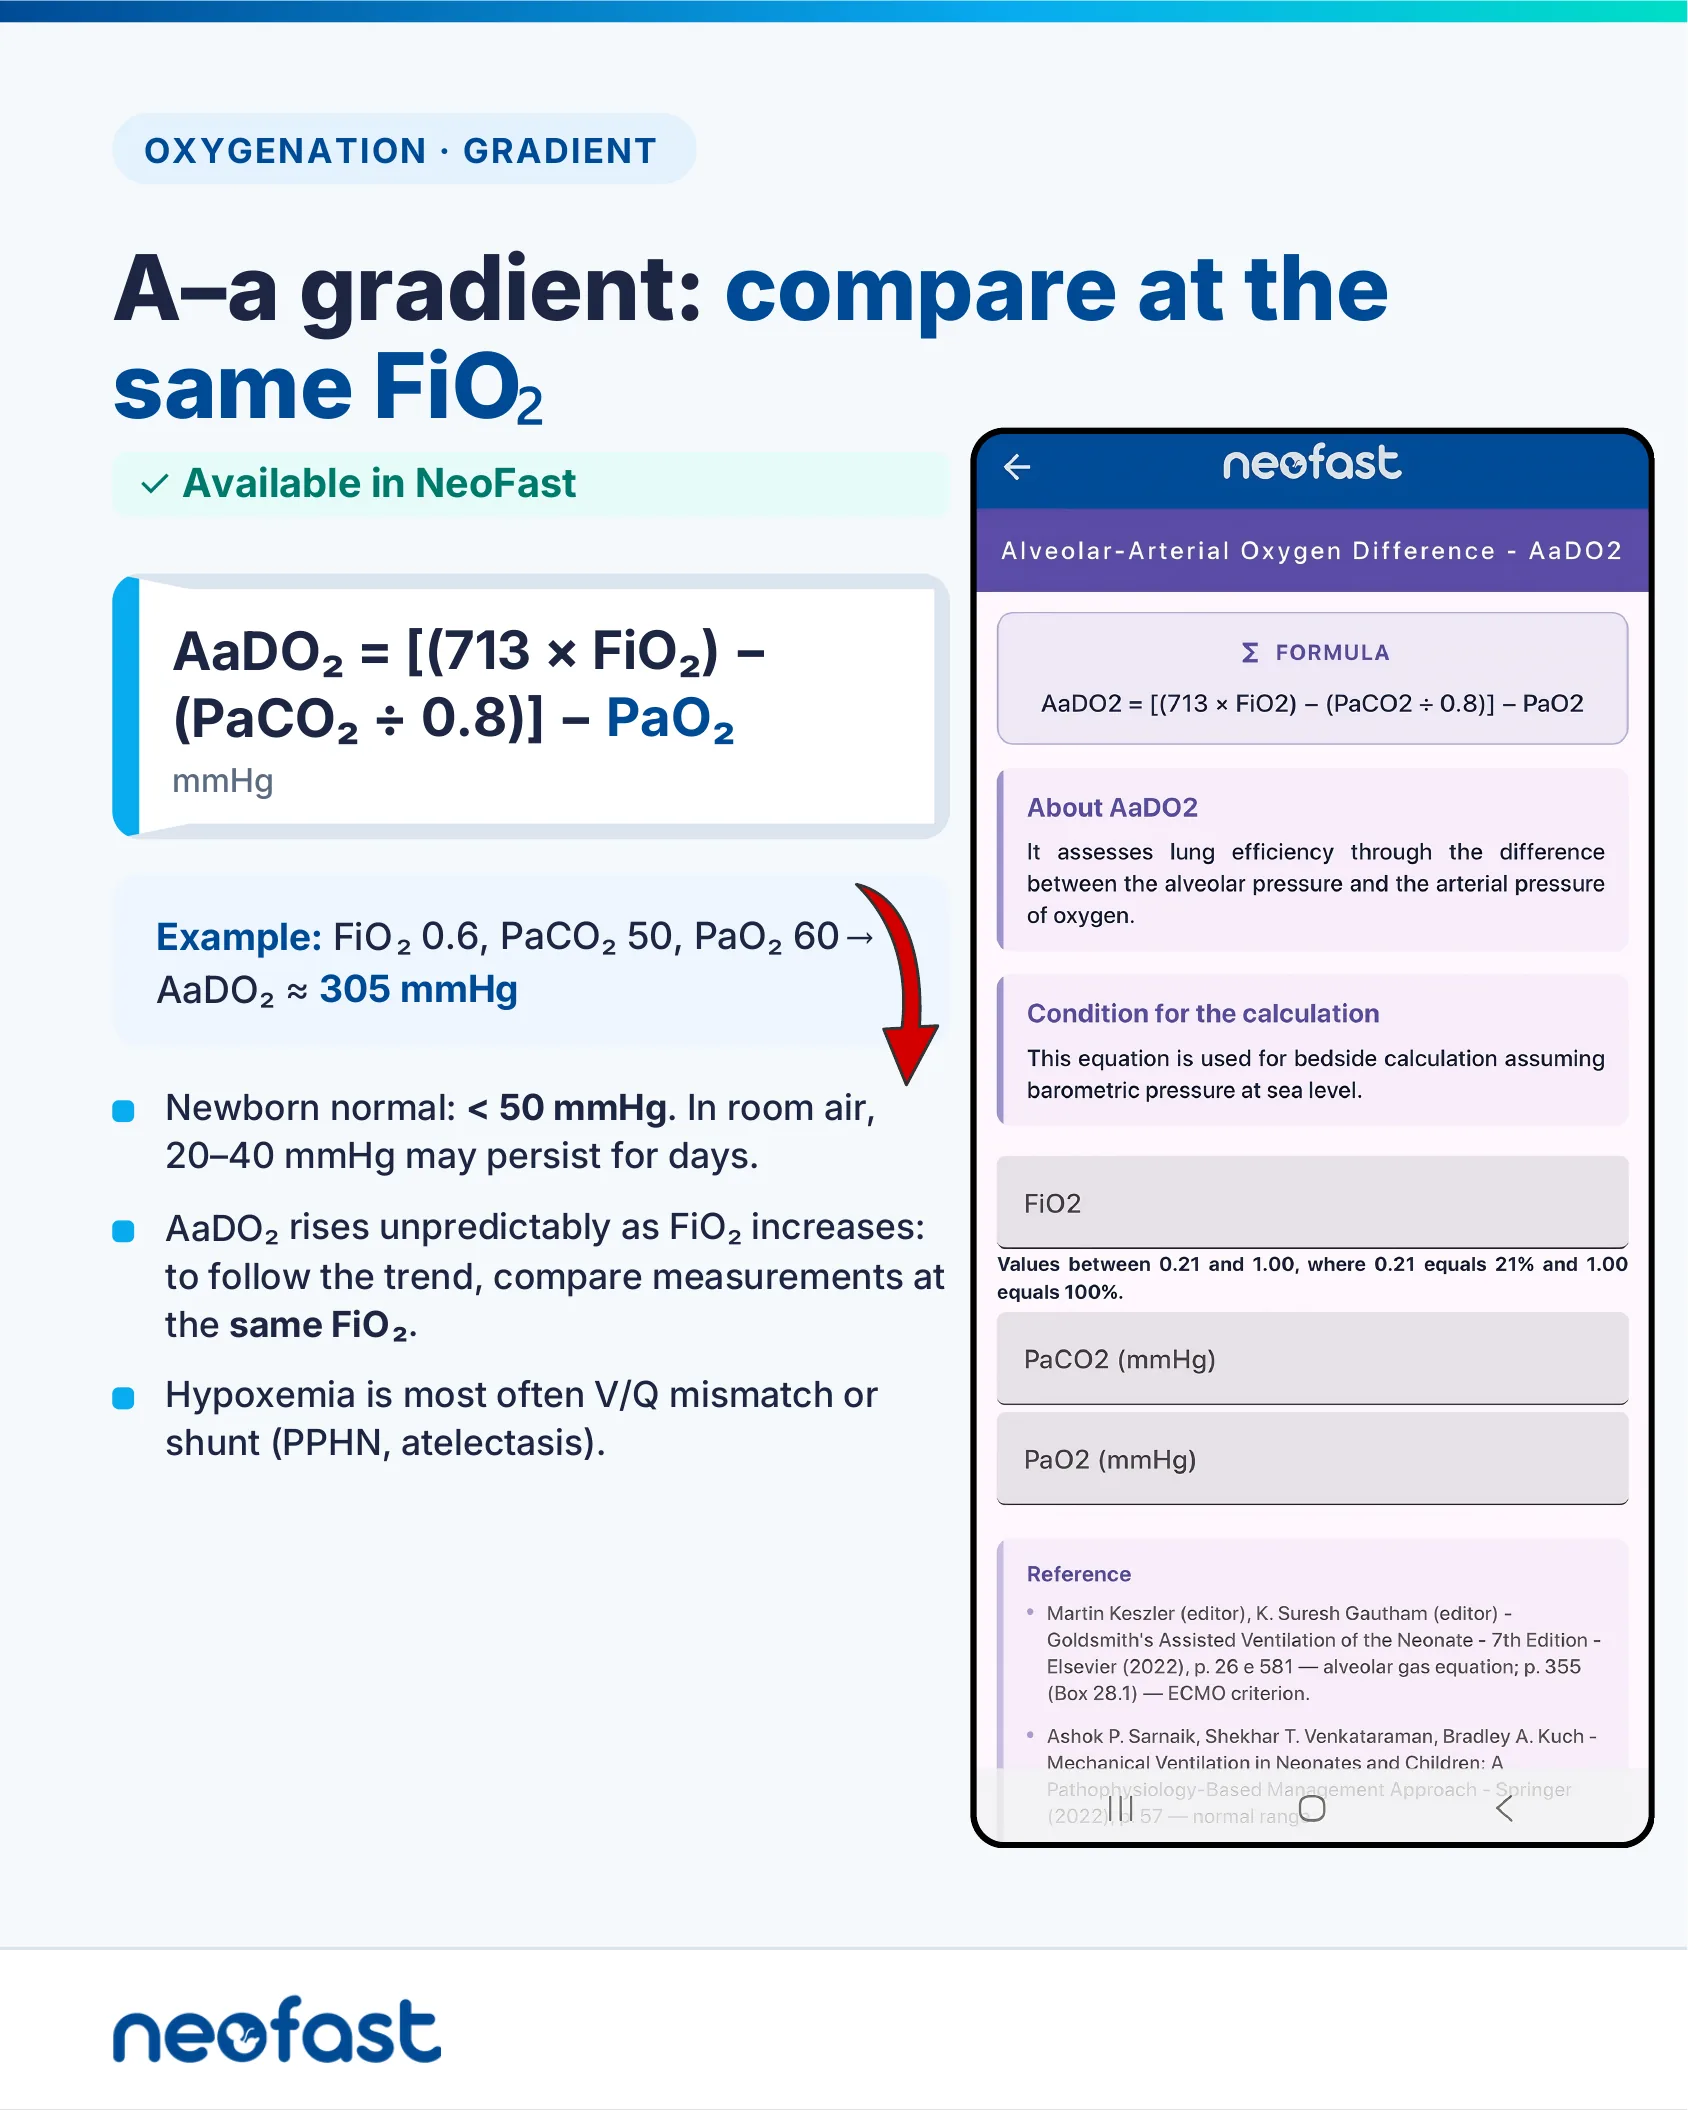
OXYGENATION · GRADIENT
A–a gradient: compare at the same FiO2
✓ Available in NeoFast
AaDO₂ = [(713 × FiO₂) – (PaCO₂ ÷ 0.8)] – PaO₂ (mmHg)
Example: FiO₂ 0.6, PaCO₂ 50, PaO₂ 60 → AaDO₂ ≈ 305 mmHg
- Newborn normal: < 50 mmHg. In room air, 20–40 mmHg may persist for days.
- AaDO₂ rises unpredictably as FiO₂ increases: to follow the trend, compare measurements at the same FiO₂.
- Hypoxemia is most often V/Q mismatch or shunt (PPHN, atelectasis).
Mobile app: Alveolar-Arterial Oxygen Difference – AaDO2
FORMULA
AaDO2 = [(713 × FiO2) – (PaCO2 ÷ 0.8)] – PaO2
About AaDO2
It assesses lung efficiency through the difference between the alveolar pressure and the arterial pressure of oxygen.
Condition for the calculation
This equation is used for bedside calculation assuming barometric pressure at sea level.
- FiO2 — Values between 0.21 and 1.00, where 0.21 equals 21% and 1.00 equals 100%.
- PaCO2 (mmHg)
- PaO2 (mmHg)
Reference
- Martin Keszler (editor), K. Suresh Gautham (editor) – Goldsmith’s Assisted Ventilation of the Neonate – 7th Edition – Elsevier (2022), p. 26 e 581 — alveolar gas equation; p. 355 (Box 28.1) — ECMO criterion.
- Ashok P. Sarnaik, Shekhar T. Venkataraman, Bradley A. Kuch – Mechanical Ventilation in Neonates and Children: A Pathophysiology-Based Management Approach – Springer (2022), p. 57 — normal range
AaDO2 calculator example
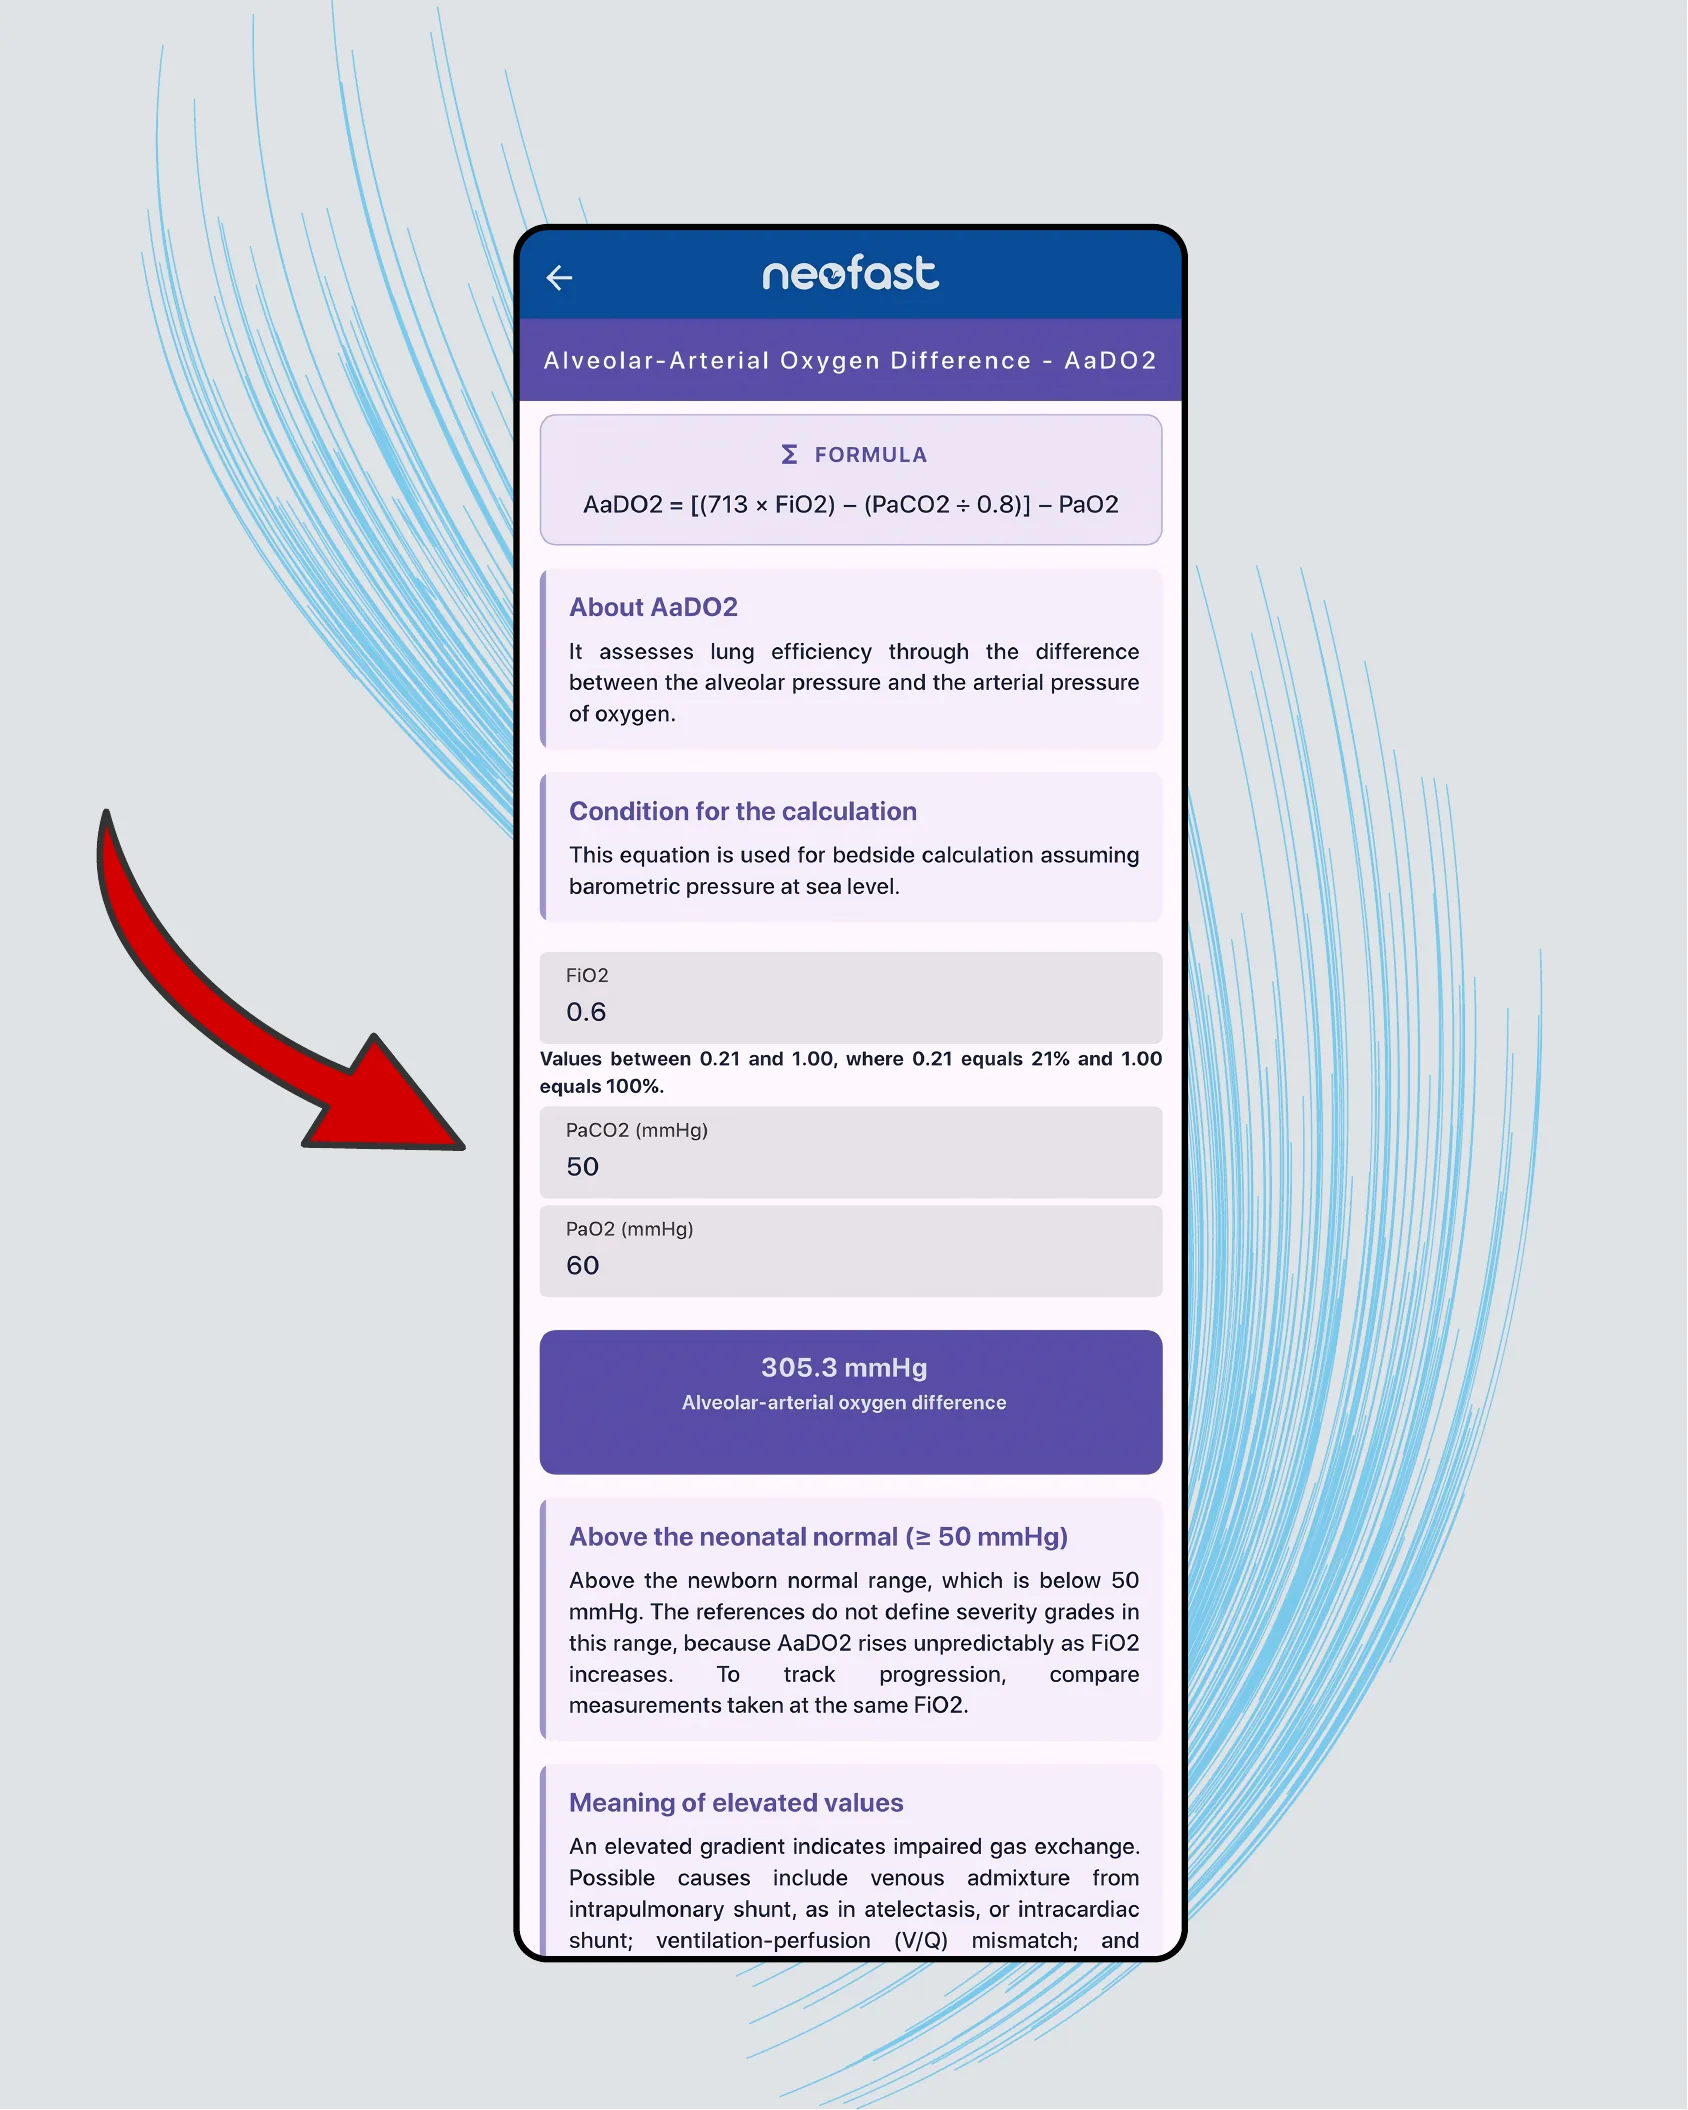
Alveolar-Arterial Oxygen Difference – AaDO2
FORMULA
AaDO2 = [(713 × FiO2) – (PaCO2 ÷ 0.8)] – PaO2
About AaDO2
It assesses lung efficiency through the difference between the alveolar pressure and the arterial pressure of oxygen.
Condition for the calculation
This equation is used for bedside calculation assuming barometric pressure at sea level.
- FiO2: 0.6 — Values between 0.21 and 1.00, where 0.21 equals 21% and 1.00 equals 100%.
- PaCO2 (mmHg): 50
- PaO2 (mmHg): 60
Result: 305.3 mmHg — Alveolar-arterial oxygen difference
Above the neonatal normal (≥ 50 mmHg)
Above the newborn normal range, which is below 50 mmHg. The references do not define severity grades in this range, because AaDO2 rises unpredictably as FiO2 increases. To track progression, compare measurements taken at the same FiO2.
Meaning of elevated values
An elevated gradient indicates impaired gas exchange. Possible causes include venous admixture from intrapulmonary shunt, as in atelectasis, or intracardiac shunt; ventilation-perfusion (V/Q) mismatch; and…
Bedside Case · Part 1 — 28-week preterm, day 3, conventional ventilation
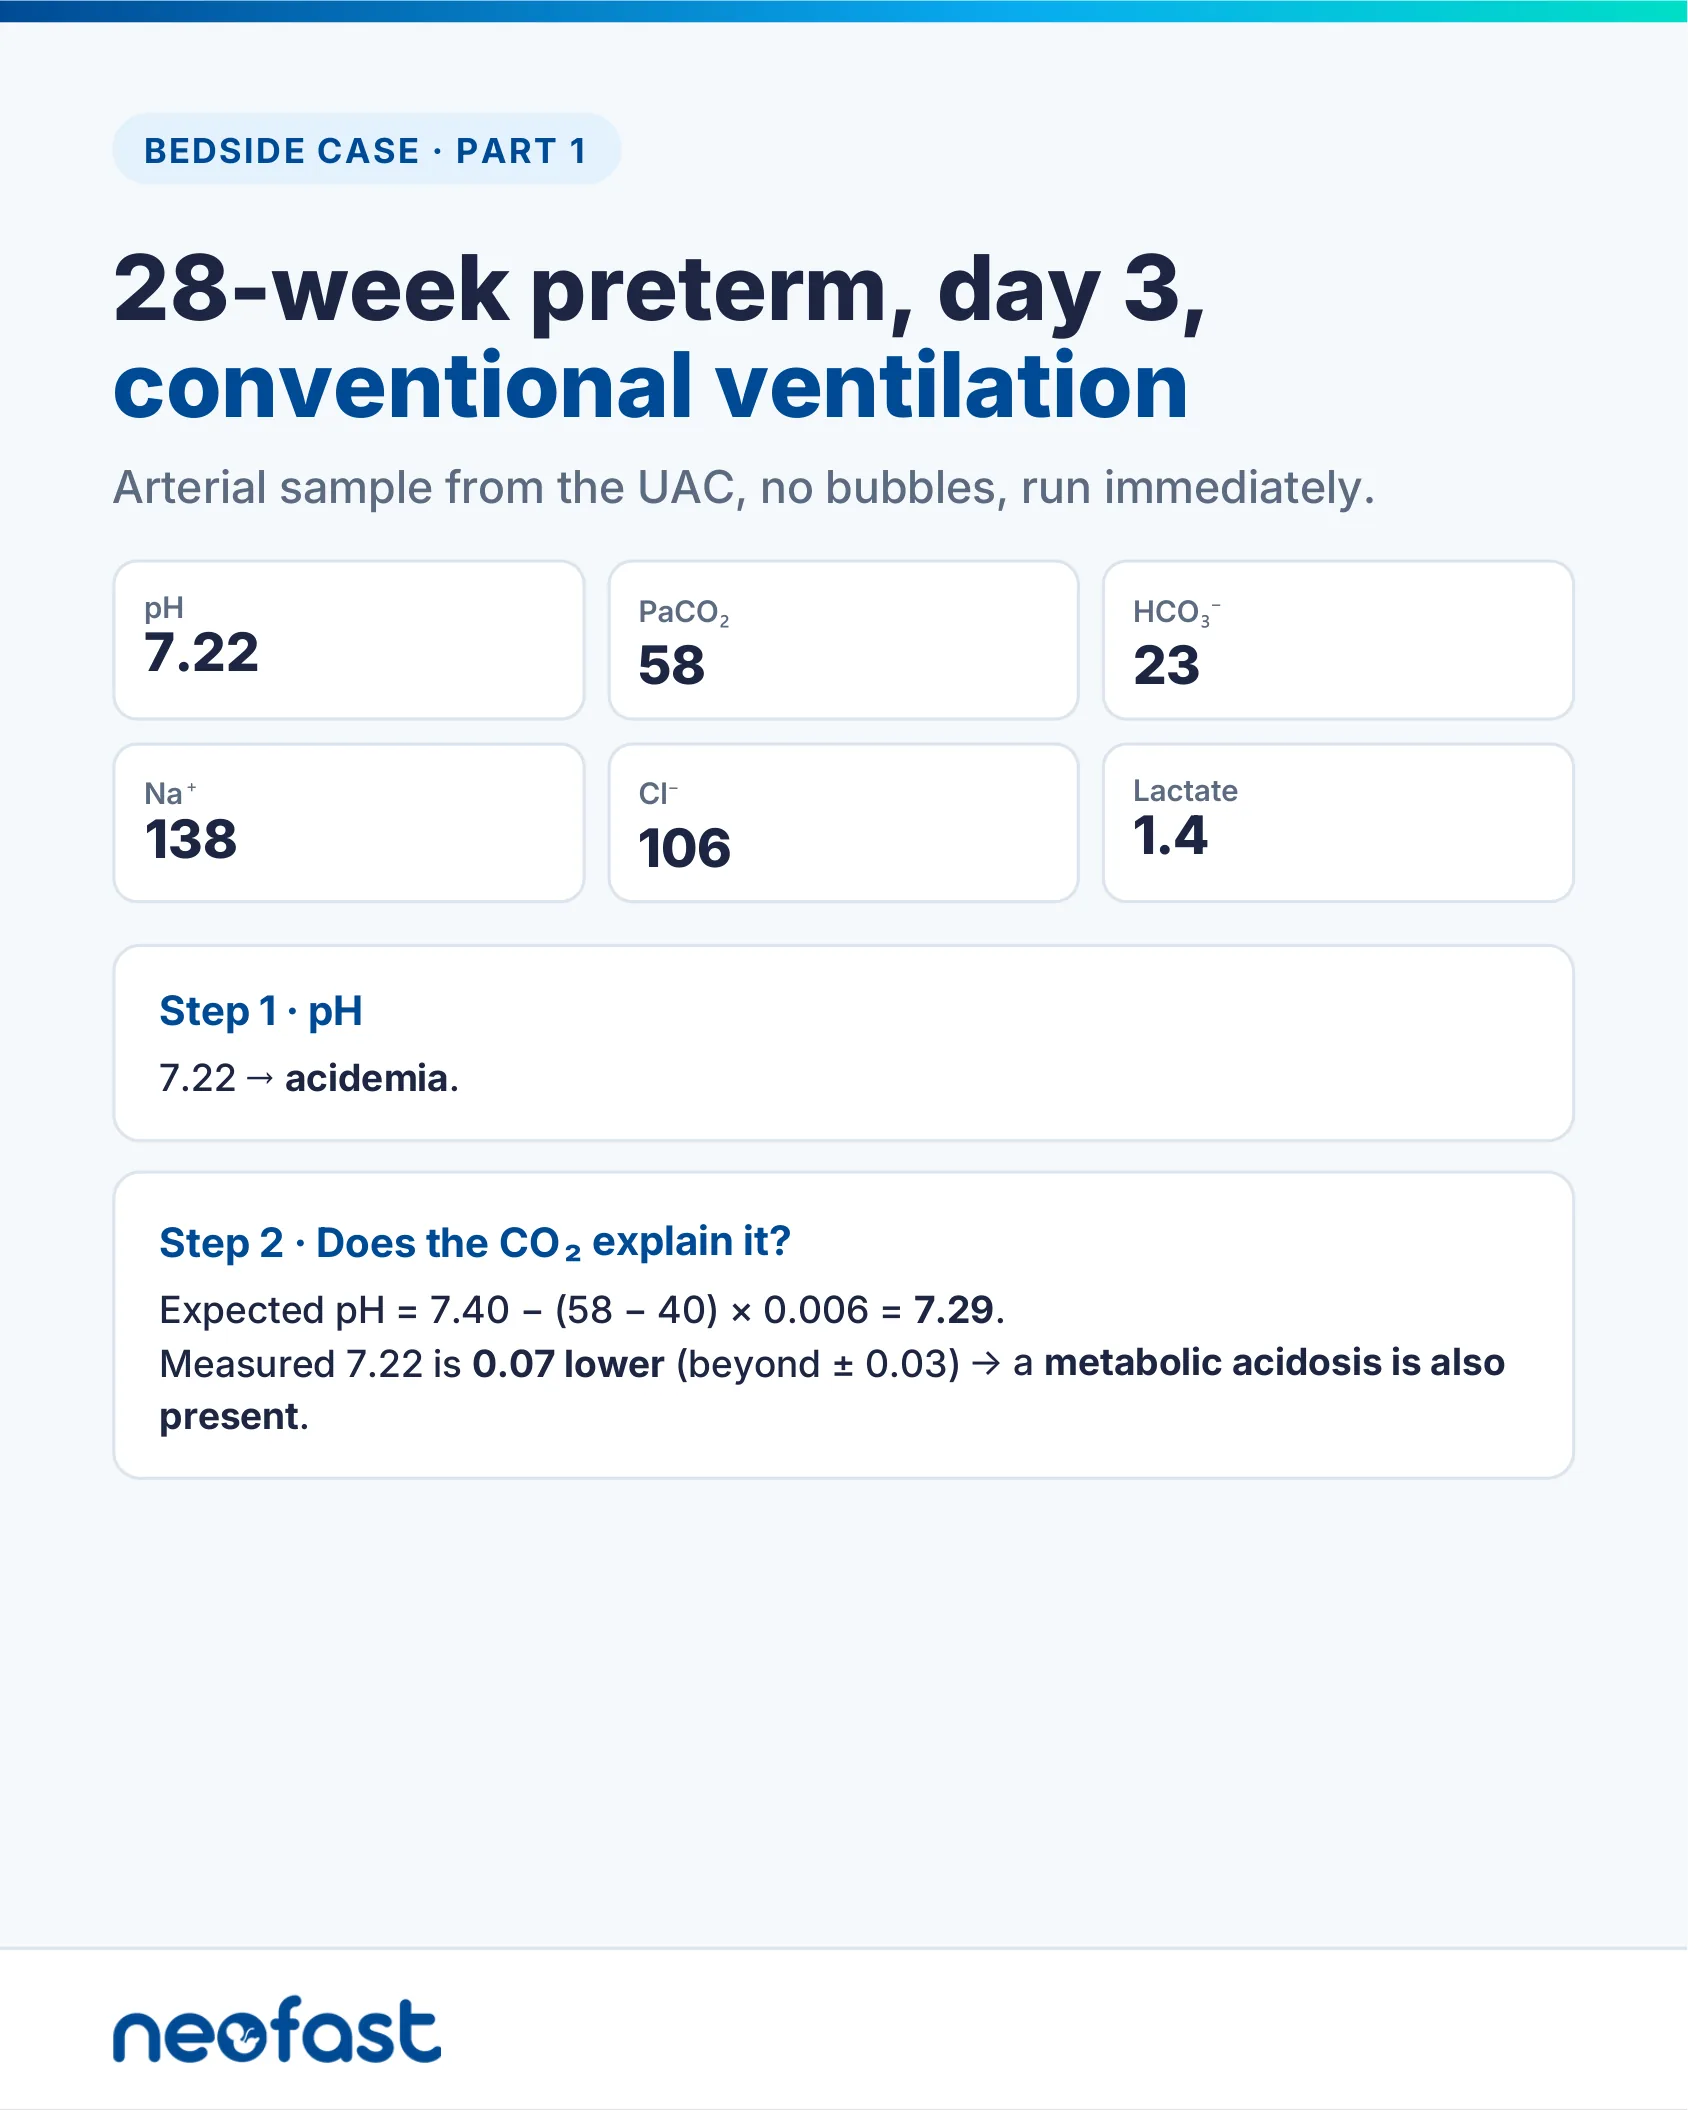
BEDSIDE CASE · PART 1
28-week preterm, day 3, conventional ventilation
Arterial sample from the UAC, no bubbles, run immediately.
| pH | PaCO₂ | HCO₃⁻ |
|---|---|---|
| 7.22 | 58 | 23 |
| Na⁺ | Cl⁻ | Lactate |
| 138 | 106 | 1.4 |
Step 1 · pH
7.22 → acidemia.
Step 2 · Does the CO₂ explain it?
Expected pH = 7.40 – (58 – 40) × 0.006 = 7.29.
Measured 7.22 is 0.07 lower (beyond ± 0.03) → a metabolic acidosis is also present.
Bedside Case · Part 2 — Putting it together
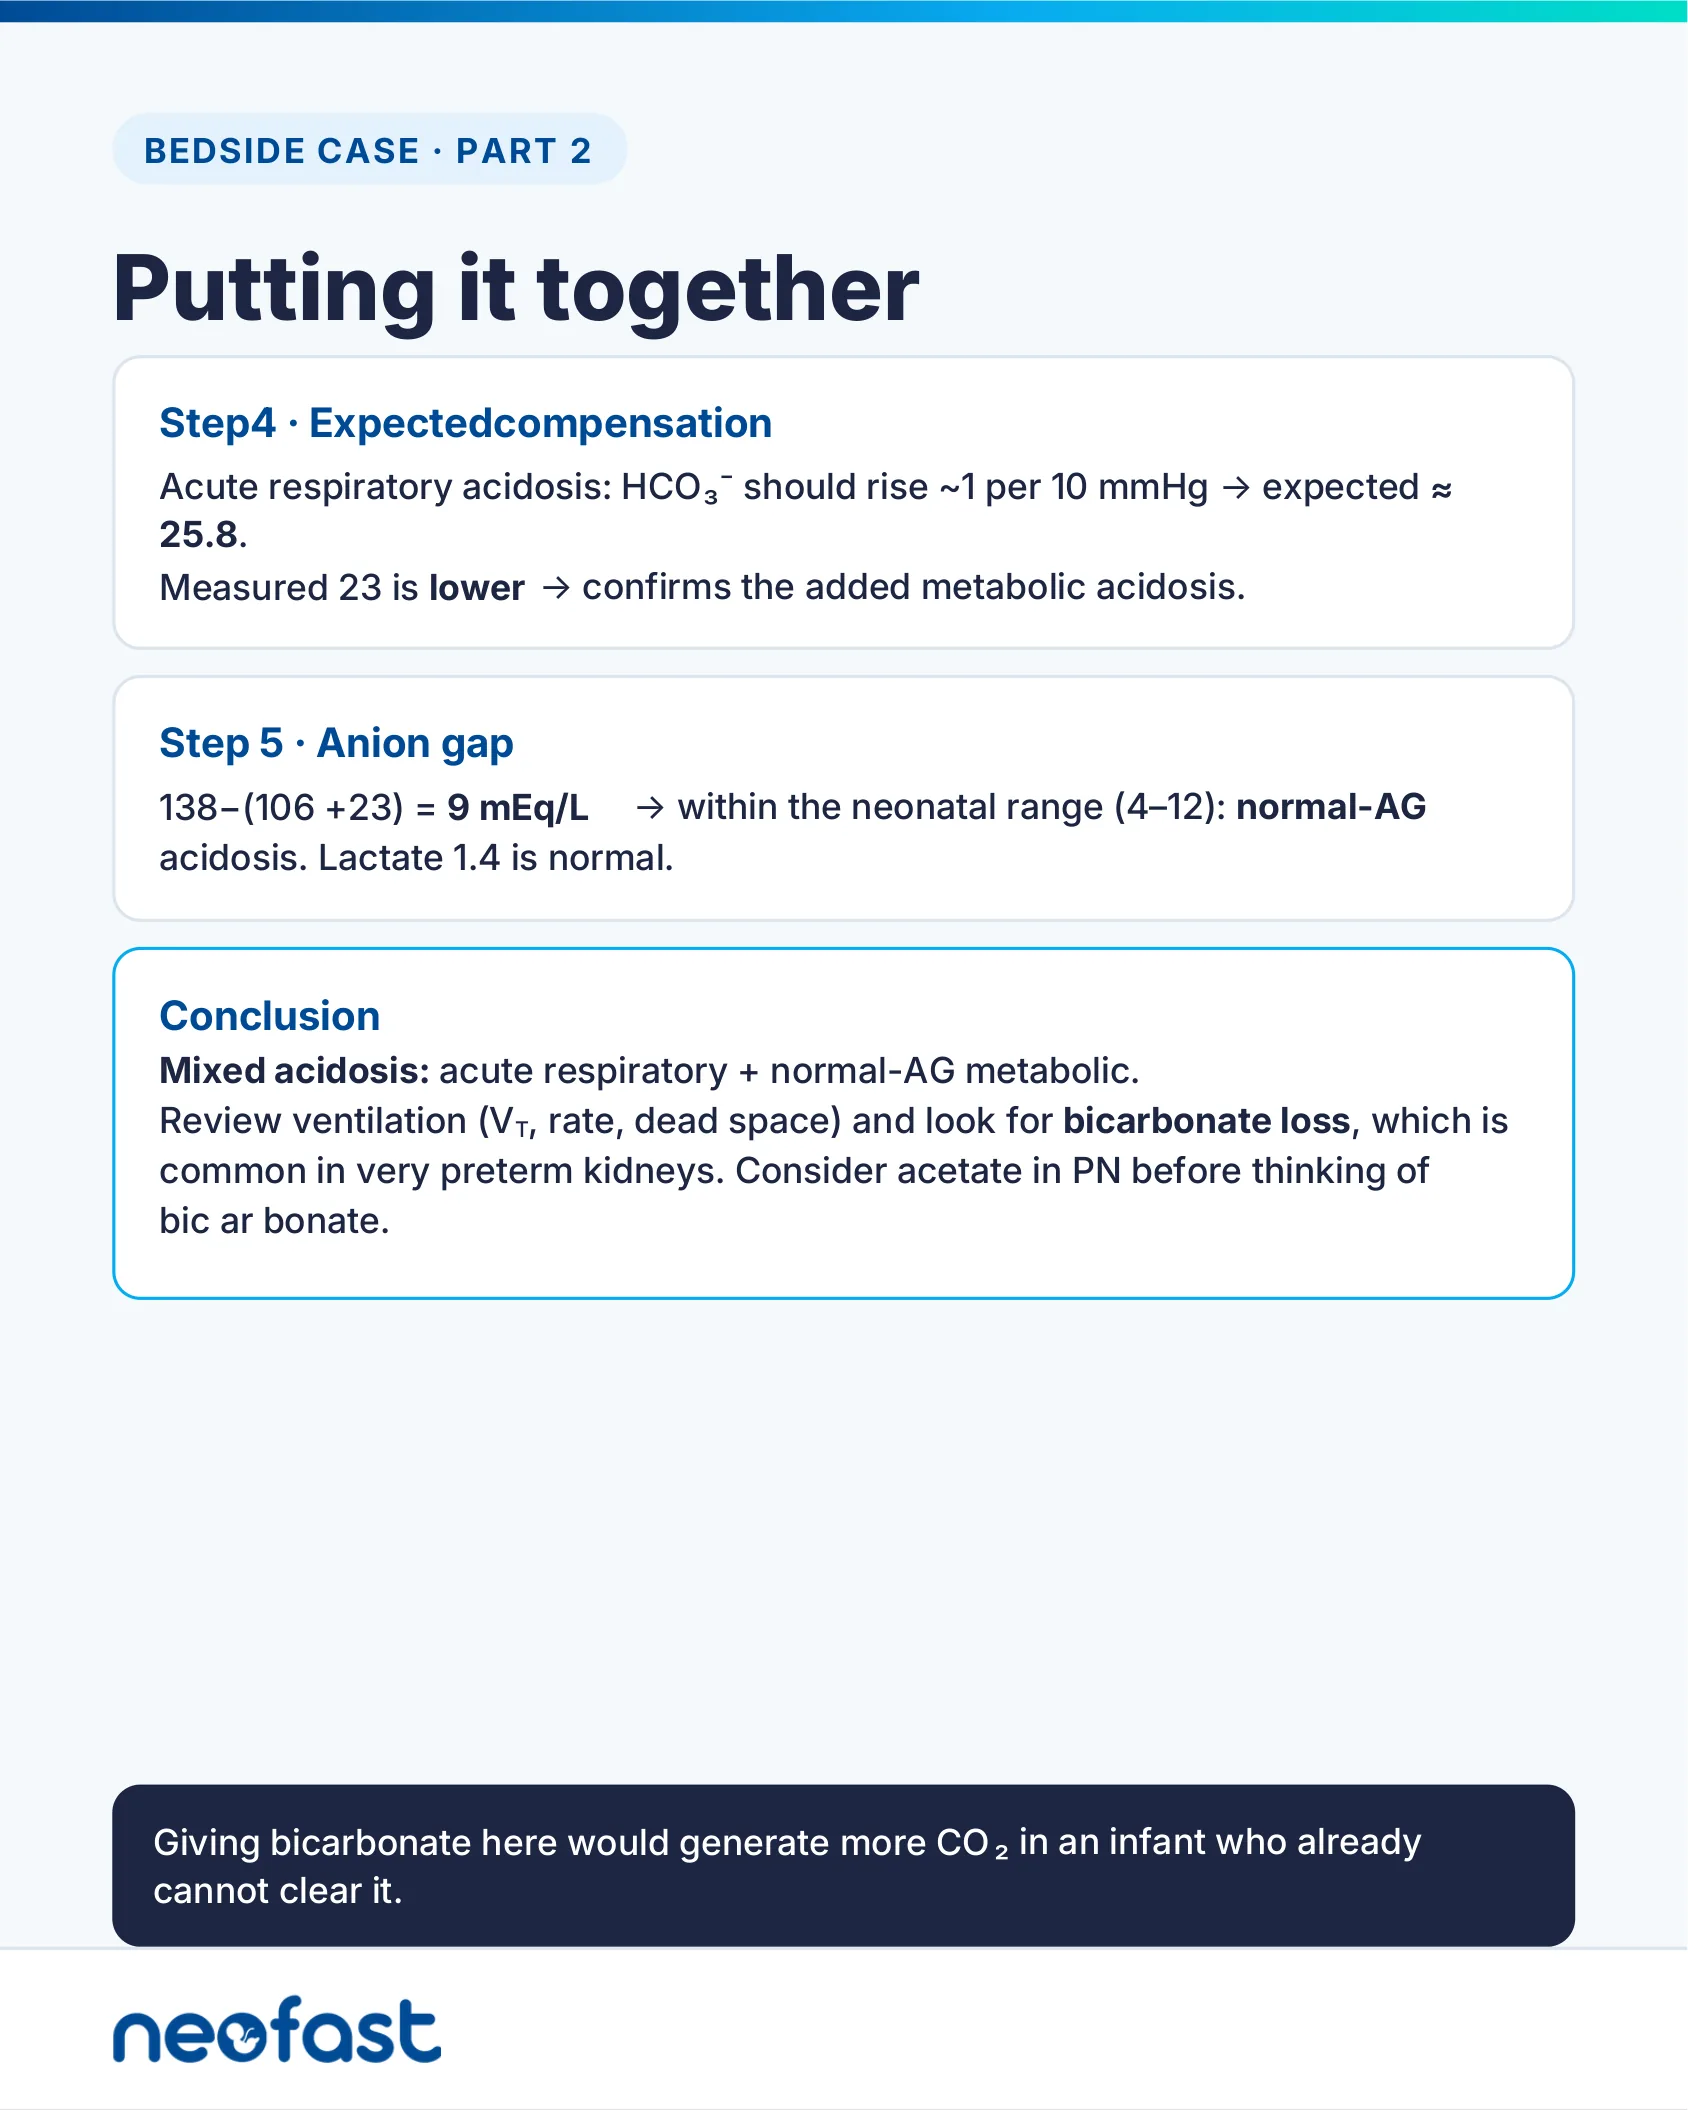
BEDSIDE CASE · PART 2
Putting it together
Step 4 · Expected compensation
Acute respiratory acidosis: HCO₃⁻ should rise ~1 per 10 mmHg → expected ≈ 25.8.
Measured 23 is lower → confirms the added metabolic acidosis.
Step 5 · Anion gap
138 – (106 + 23) = 9 mEq/L → within the neonatal range (4–12): normal-AG acidosis. Lactate 1.4 is normal.
Conclusion
Mixed acidosis: acute respiratory + normal-AG metabolic.
Review ventilation (VT, rate, dead space) and look for bicarbonate loss, which is common in very preterm kidneys. Consider acetate in PN before thinking of bicarbonate.
Giving bicarbonate here would generate more CO₂ in an infant who already cannot clear it.
Bedside checklist
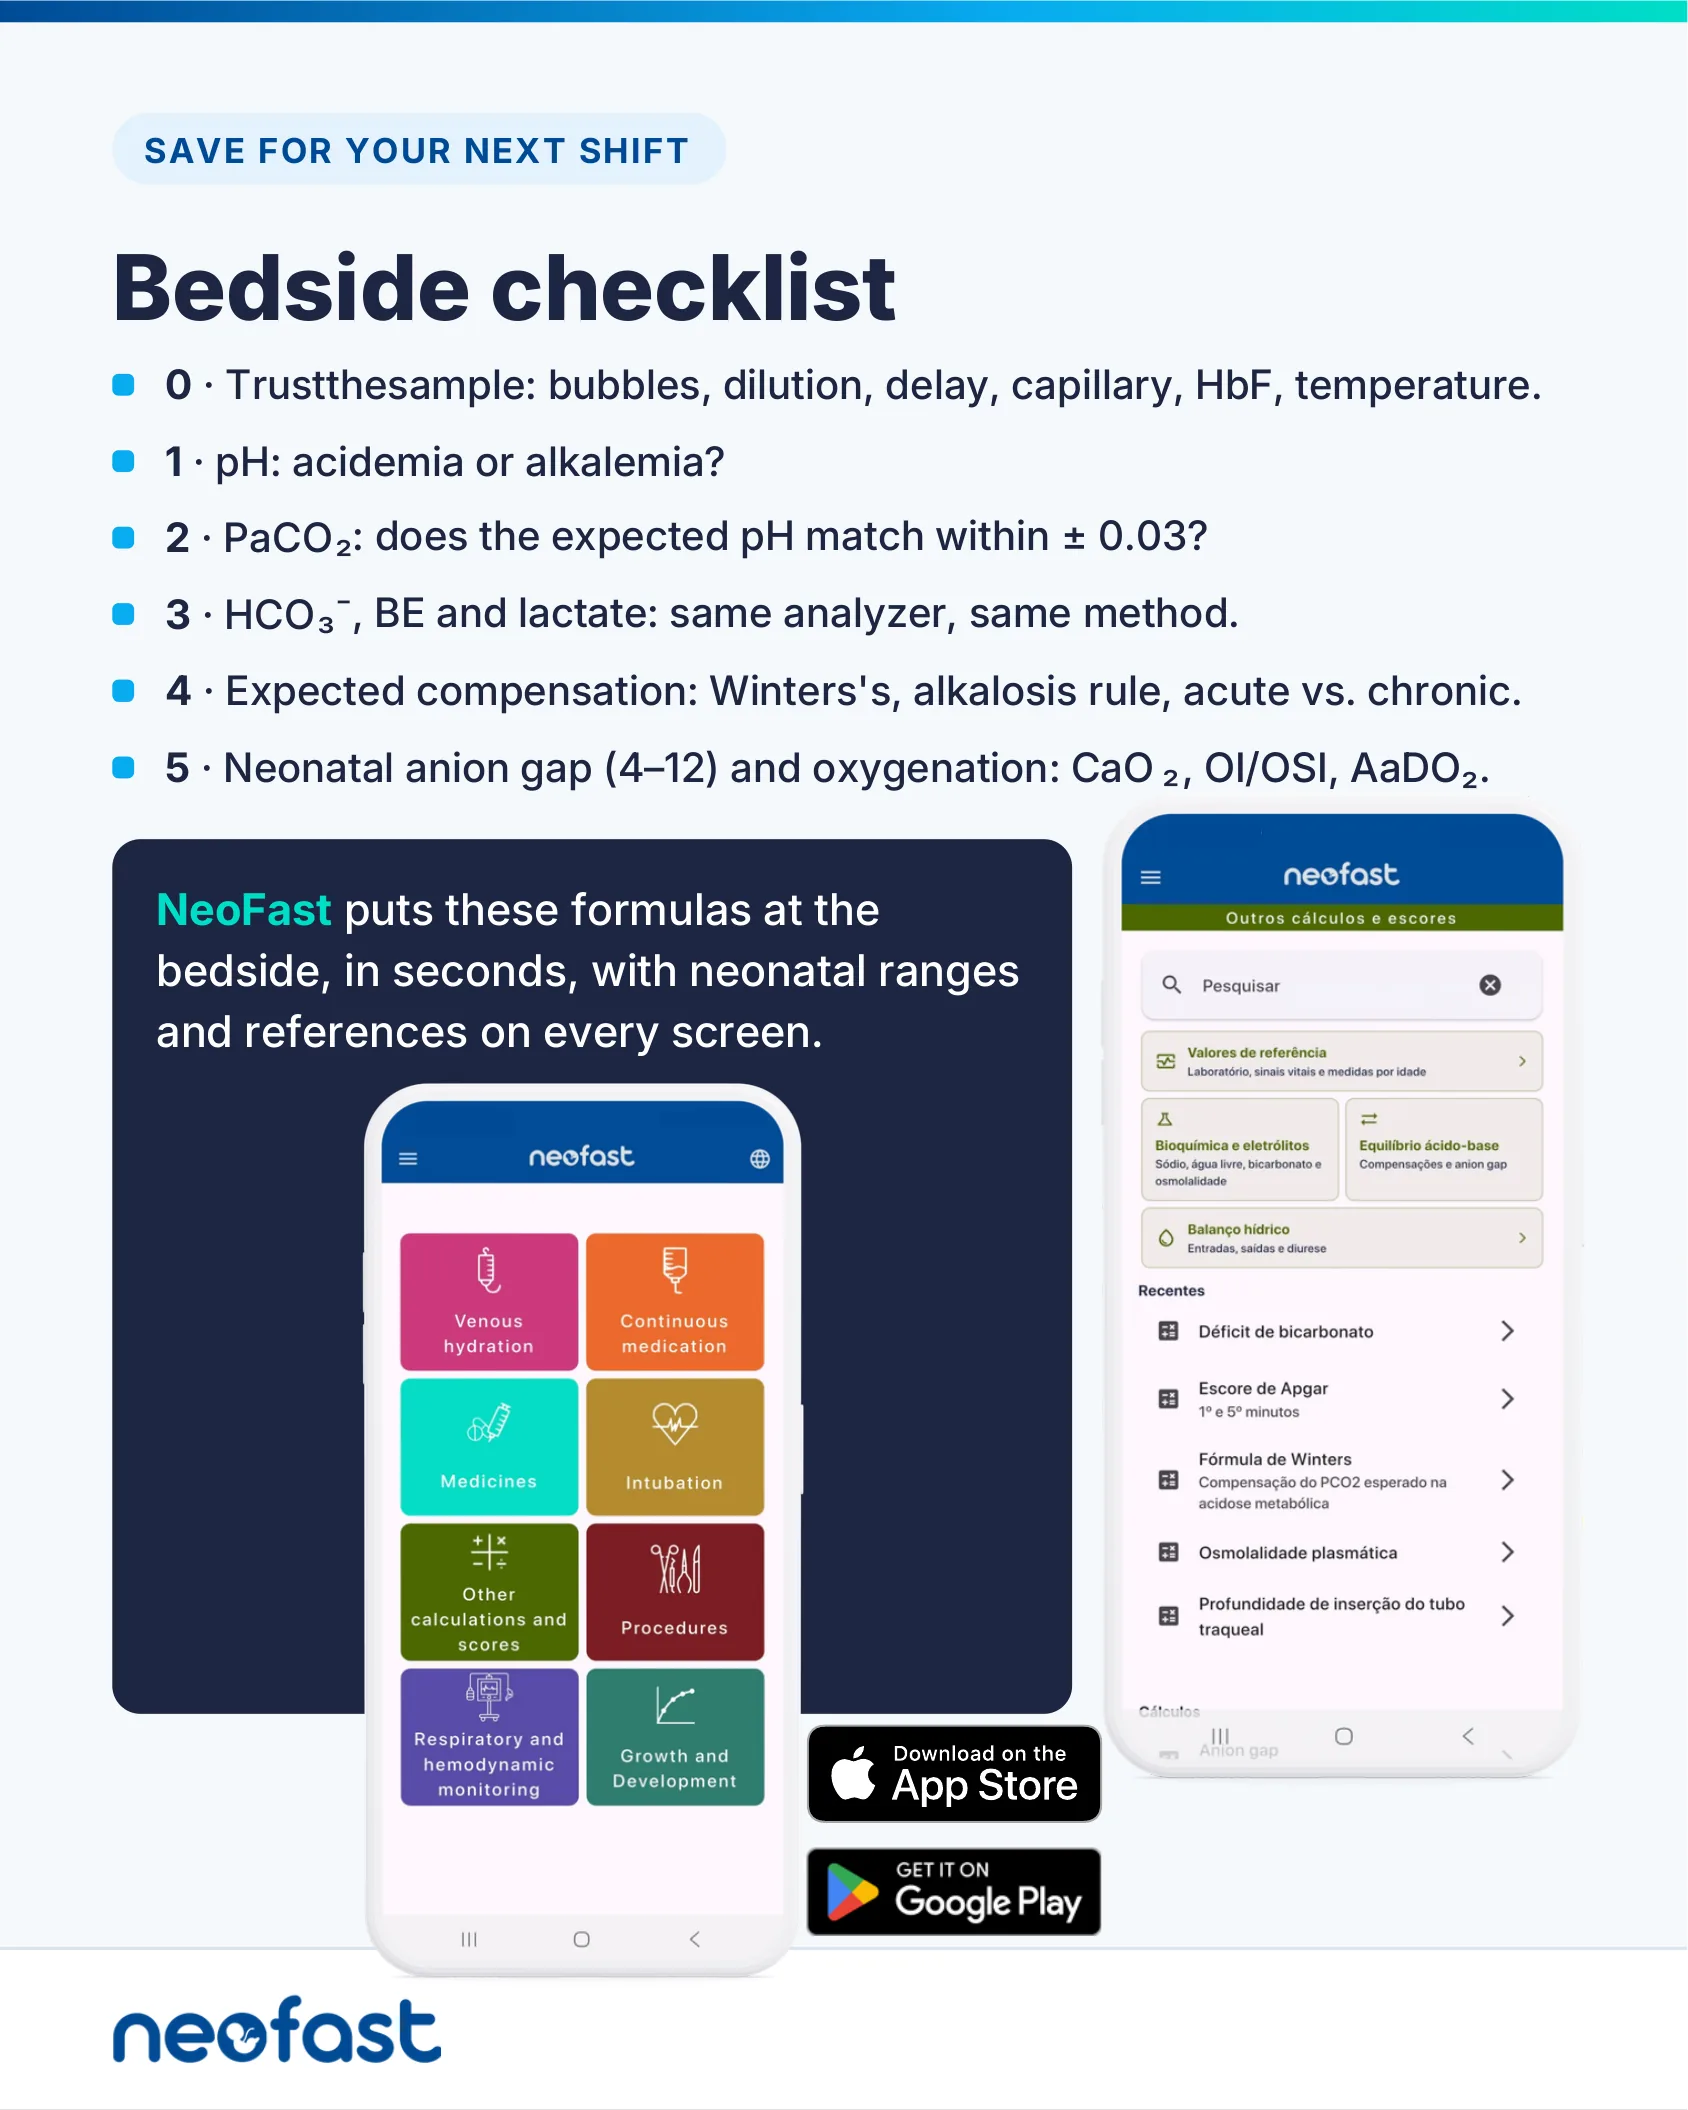
SAVE FOR YOUR NEXT SHIFT
Bedside checklist
- 0 · Trust the sample: bubbles, dilution, delay, capillary, HbF, temperature.
- 1 · pH: acidemia or alkalemia?
- 2 · PaCO₂: does the expected pH match within ± 0.03?
- 3 · HCO₃⁻, BE and lactate: same analyzer, same method.
- 4 · Expected compensation: Winters’s, alkalosis rule, acute vs. chronic.
- 5 · Neonatal anion gap (4–12) and oxygenation: CaO₂, OI/OSI, AaDO₂.
NeoFast puts these formulas at the bedside, in seconds, with neonatal ranges and references on every screen.
- Venous hydration
- Continuous medication
- Medicines
- Intubation
- Other calculations and scores
- Procedures
- Respiratory and hemodynamic monitoring
- Growth and Development
Download on the App Store · Get it on Google Play
Frequently asked questions
What is Winters’ formula for expected pCO2 compensation in metabolic acidosis?
Expected pCO2 = (1.5 × HCO3−) + 8 (± 2) mmHg. For example, with HCO3− 12, expected pCO2 is 26 mmHg (range 24–28). If the patient’s measured pCO2 is higher, there is an associated respiratory acidosis; if lower, an associated respiratory alkalosis; if within range, compensation is adequate (pure metabolic acidosis).
What is the normal anion gap range in neonates and when does it suggest lactic acidosis?
The neonatal anion gap (AG = Na+ − (Cl− + HCO3−), without potassium) normal range is 4–12 mEq/L (8 ± 4) in critically ill newborns during week 1. In metabolic acidosis, an AG above 16 suggests lactic acidosis, while an AG between 8 and 16 does not differentiate the underlying cause.
How do you calculate expected pCO2 compensation in chronic metabolic alkalosis?
Using the Boston rule: expected pCO2 = 20 + 0.7 × HCO3− (± 5) mmHg. For example, with HCO3− 34, expected pCO2 is 43.8 mmHg (range 38.8–48.8). Other rules exist (Oh’s: 0.9 × HCO3− + 9 ± 2; Adrogué-Madias: 40 + 0.7 × (HCO3− − 24)), but these were derived from adult/dog studies and can differ by 3–11 mmHg.
How is the sodium bicarbonate dose calculated in neonates, and how should it be given?
HCO3− deficit (mEq) = base deficit × weight (kg) × 0.3. The 8.4% solution (1 mEq/mL) should be diluted 1:1 with sterile water to 0.5 mEq/mL and infused slowly, preferably over 30–60 minutes. It is not for routine use, is no longer recommended in CPR, and may be harmful in hypoxia with metabolic acidosis since it generates CO2.
What do the Oxygenation Index (OI) cutoffs mean, and how does OSI relate to OI?
OI = FiO2 × 100 × MAP ÷ PaO2. Published cutoffs: OI >15 indicates severe respiratory compromise, >25 suggests considering ECMO, and ≥40 has historically been associated with ~80% mortality and used as an ECMO criterion. OSI (the non-invasive version using SpO2 instead of PaO2) correlates with OI ≈ 2 × OSI when preductal SpO2 is 70–99%; an OSI of 5–12 reaches the PARDS 2.0 diagnostic threshold on invasive ventilation.