Key takeaways
- Neonatal reference intervals are dynamic and differ between term and preterm infants — a normal value for a preterm baby can be a critical alert for a term baby.
- Hemoglobin falls from birth (term 15.4–23.4 g/dL) toward physiological anemia (about 9.0–15.5 g/dL at 1 month), and reticulocytes drop to <3% by day 7.
- A Rodwell immature-to-total neutrophil (I:T) ratio above 0.2 is a critical indicator of infection or sepsis.
- Preterm infants show prolonged aPTT (up to 79s vs 54s), higher alkaline phosphatase (up to 462 vs 232 U/L, osteopenia risk), higher baseline ammonia, and lower CSF glucose.
- A glucose below 40 mg/dL triggers immediate hypoglycemia protocols; the ideal is above 45–50 mg/dL.
The Neonatal Blueprint: Complete Laboratory Reference Intervals
Clinical editorial Reference guide
The Neonatal Blueprint: Complete Laboratory Reference Intervals
A comparative clinical data dashboard for Term and Preterm neonates.
Navigating the Neonatal Dashboard
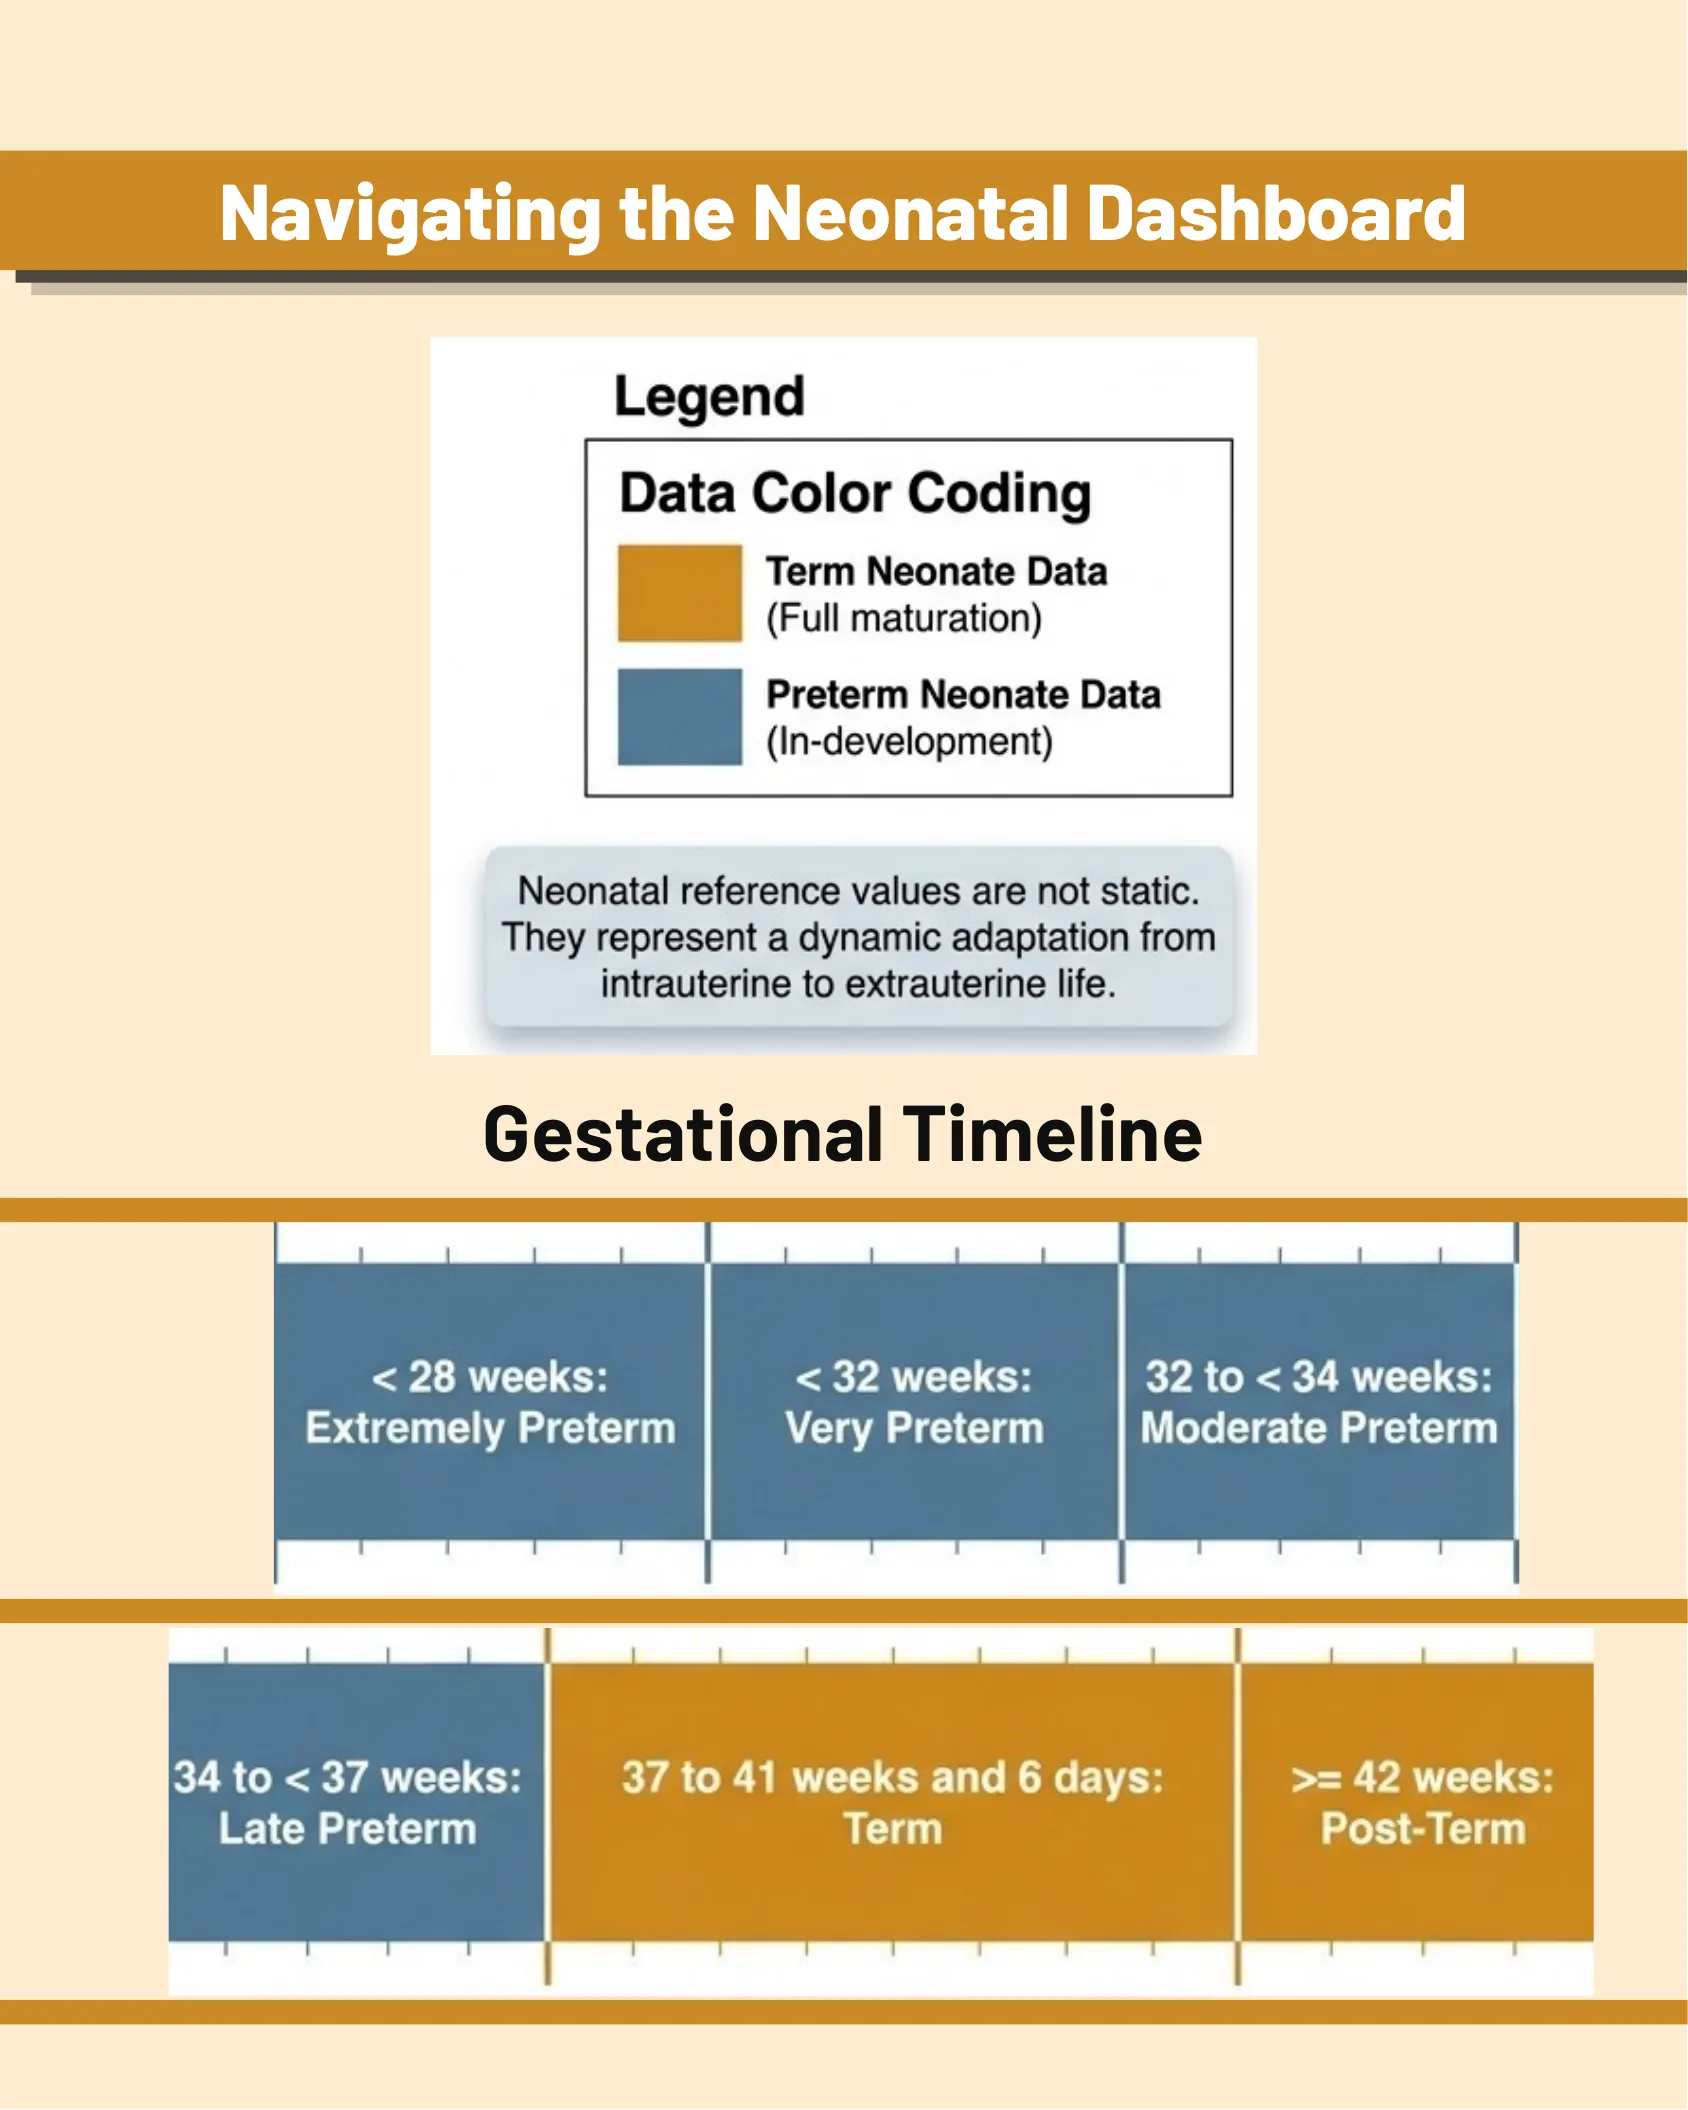
Legend
Data Color Coding
- Term Neonate Data (Full maturation) — amber/orange
- Preterm Neonate Data (In-development) — blue
Neonatal reference values are not static. They represent a dynamic adaptation from intrauterine to extrauterine life.
Gestational Timeline
- < 28 weeks: Extremely Preterm
- < 32 weeks: Very Preterm
- 32 to < 34 weeks: Moderate Preterm
- 34 to < 37 weeks: Late Preterm
- 37 to 41 weeks and 6 days: Term
- >= 42 weeks: Post-Term
Erythroid Lineage & Physiological Anemia Trajectory
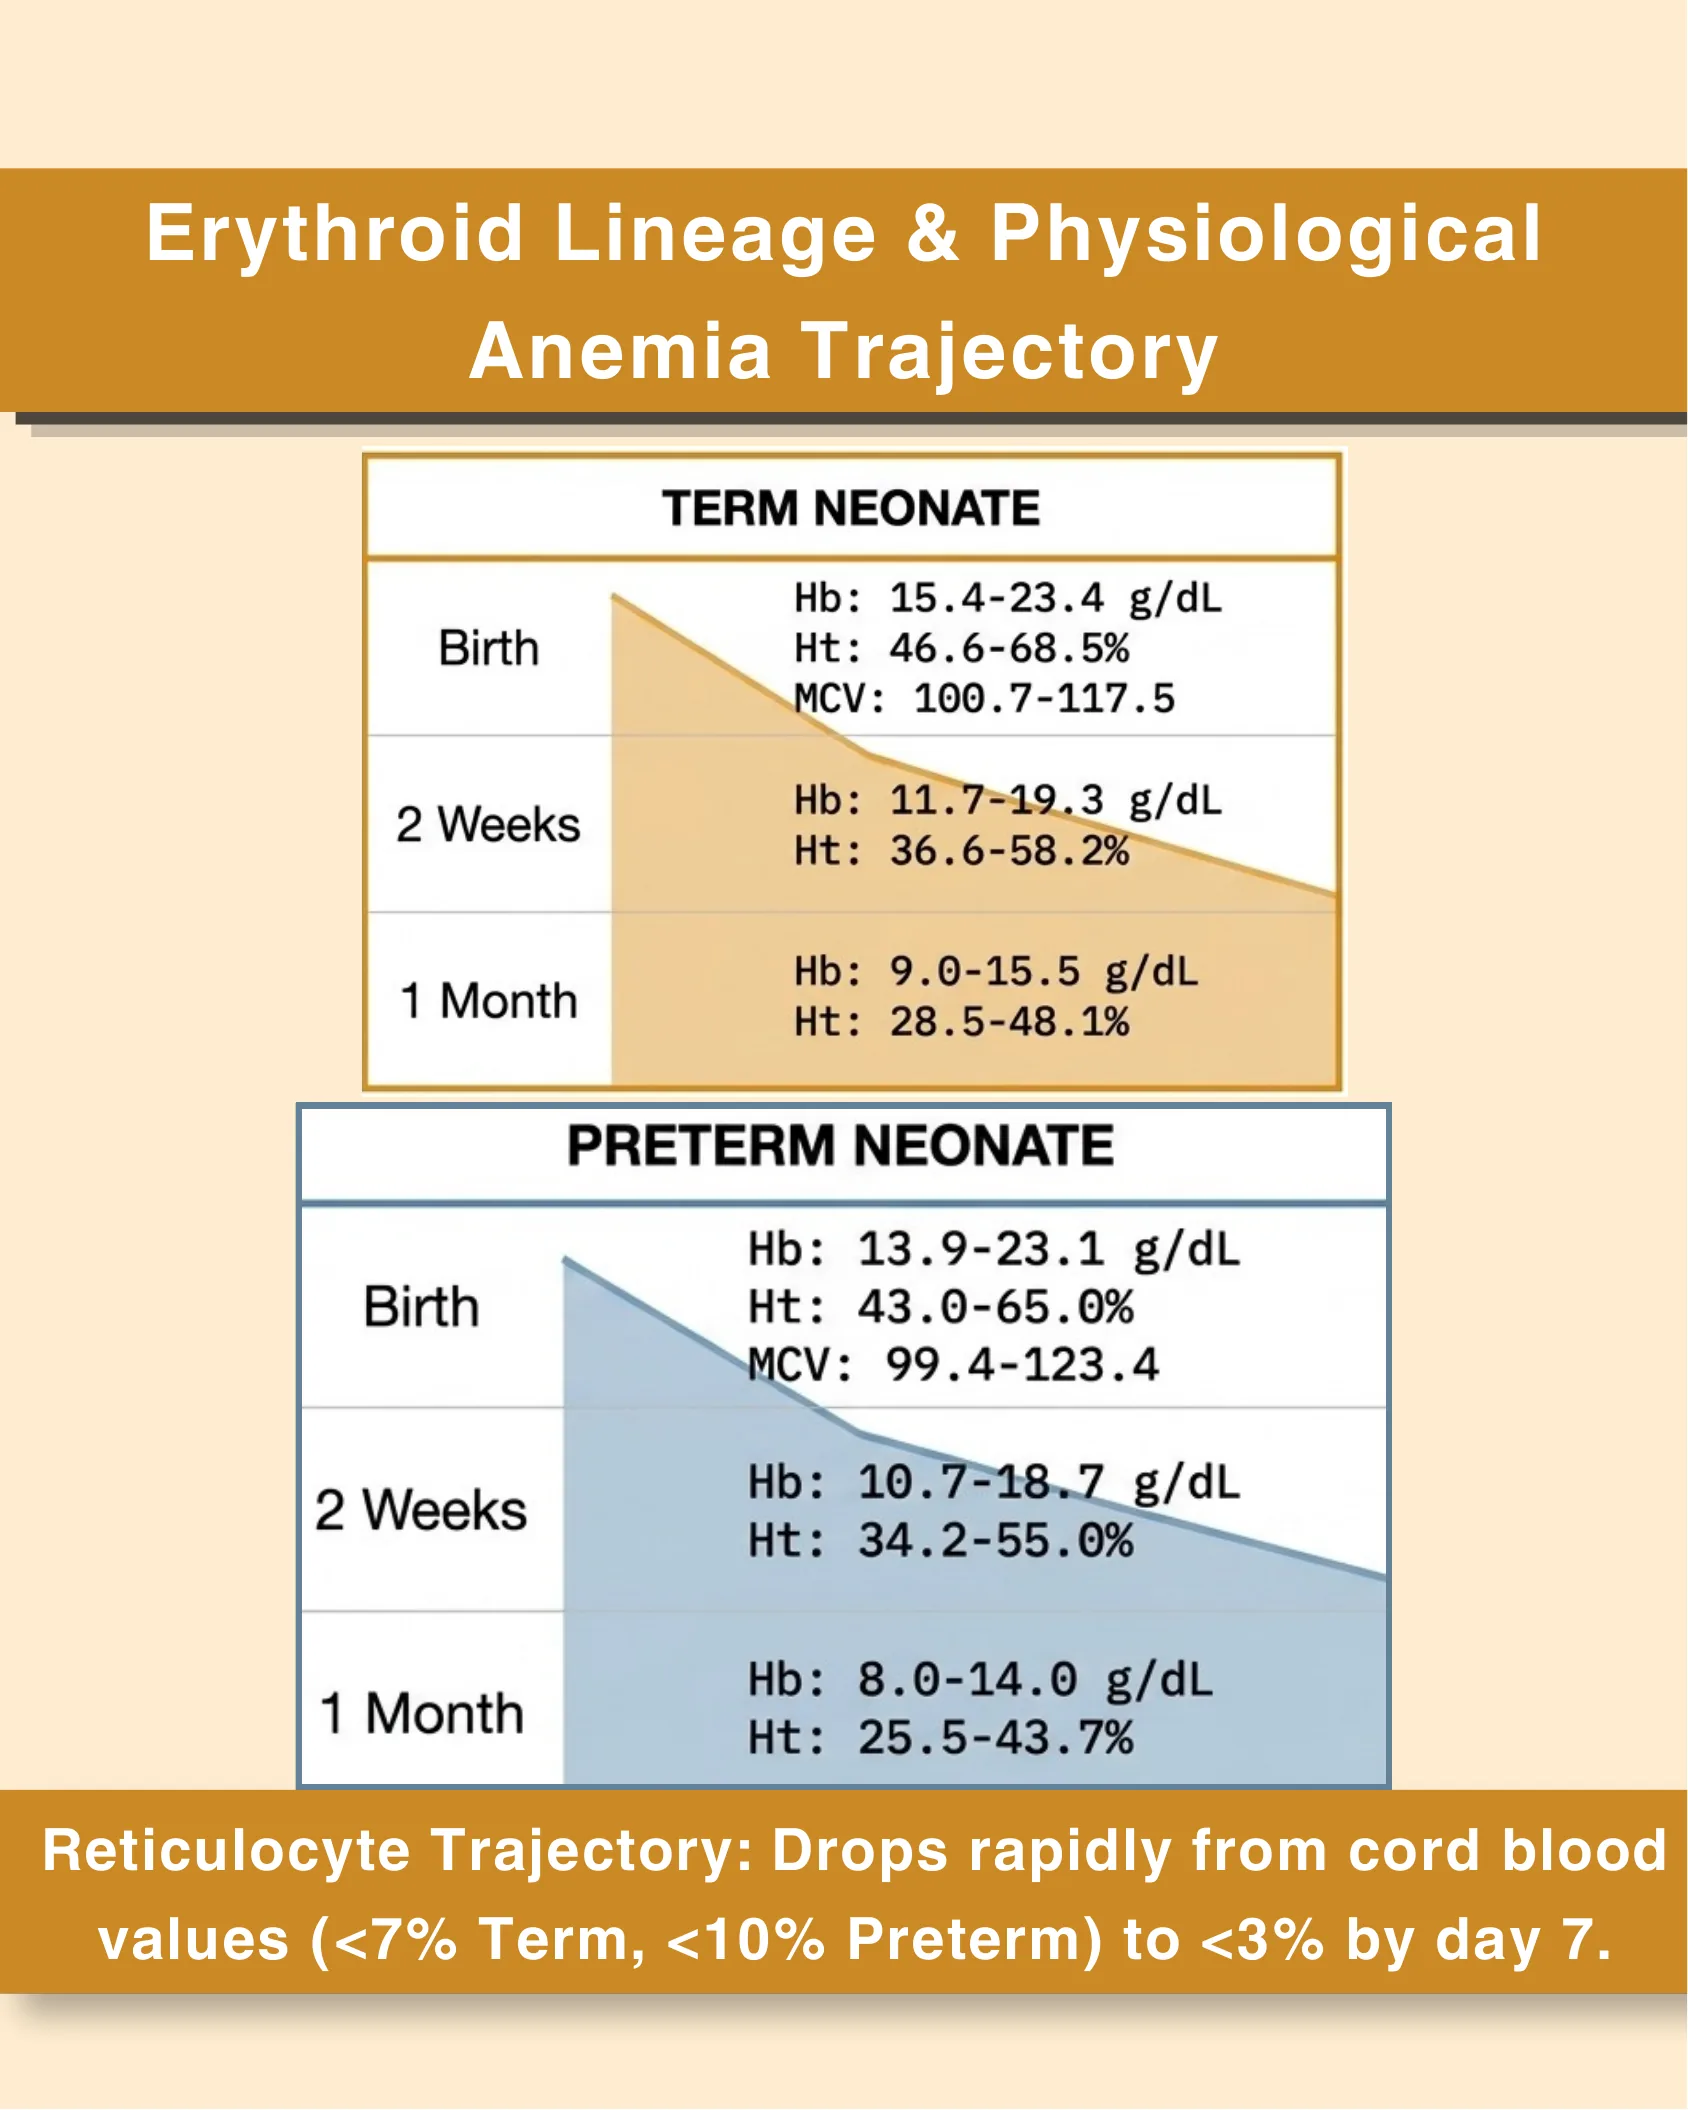
Term Neonate
| Age | Values |
|---|---|
| Birth | Hb: 15.4-23.4 g/dL; Ht: 46.6-68.5%; MCV: 100.7-117.5 |
| 2 Weeks | Hb: 11.7-19.3 g/dL; Ht: 36.6-58.2% |
| 1 Month | Hb: 9.0-15.5 g/dL; Ht: 28.5-48.1% |
Preterm Neonate
| Age | Values |
|---|---|
| Birth | Hb: 13.9-23.1 g/dL; Ht: 43.0-65.0%; MCV: 99.4-123.4 |
| 2 Weeks | Hb: 10.7-18.7 g/dL; Ht: 34.2-55.0% |
| 1 Month | Hb: 8.0-14.0 g/dL; Ht: 25.5-43.7% |
Reticulocyte Trajectory: Drops rapidly from cord blood values (<7% Term, <10% Preterm) to <3% by day 7.
Leukocyte Differentials and Thrombotic Baselines
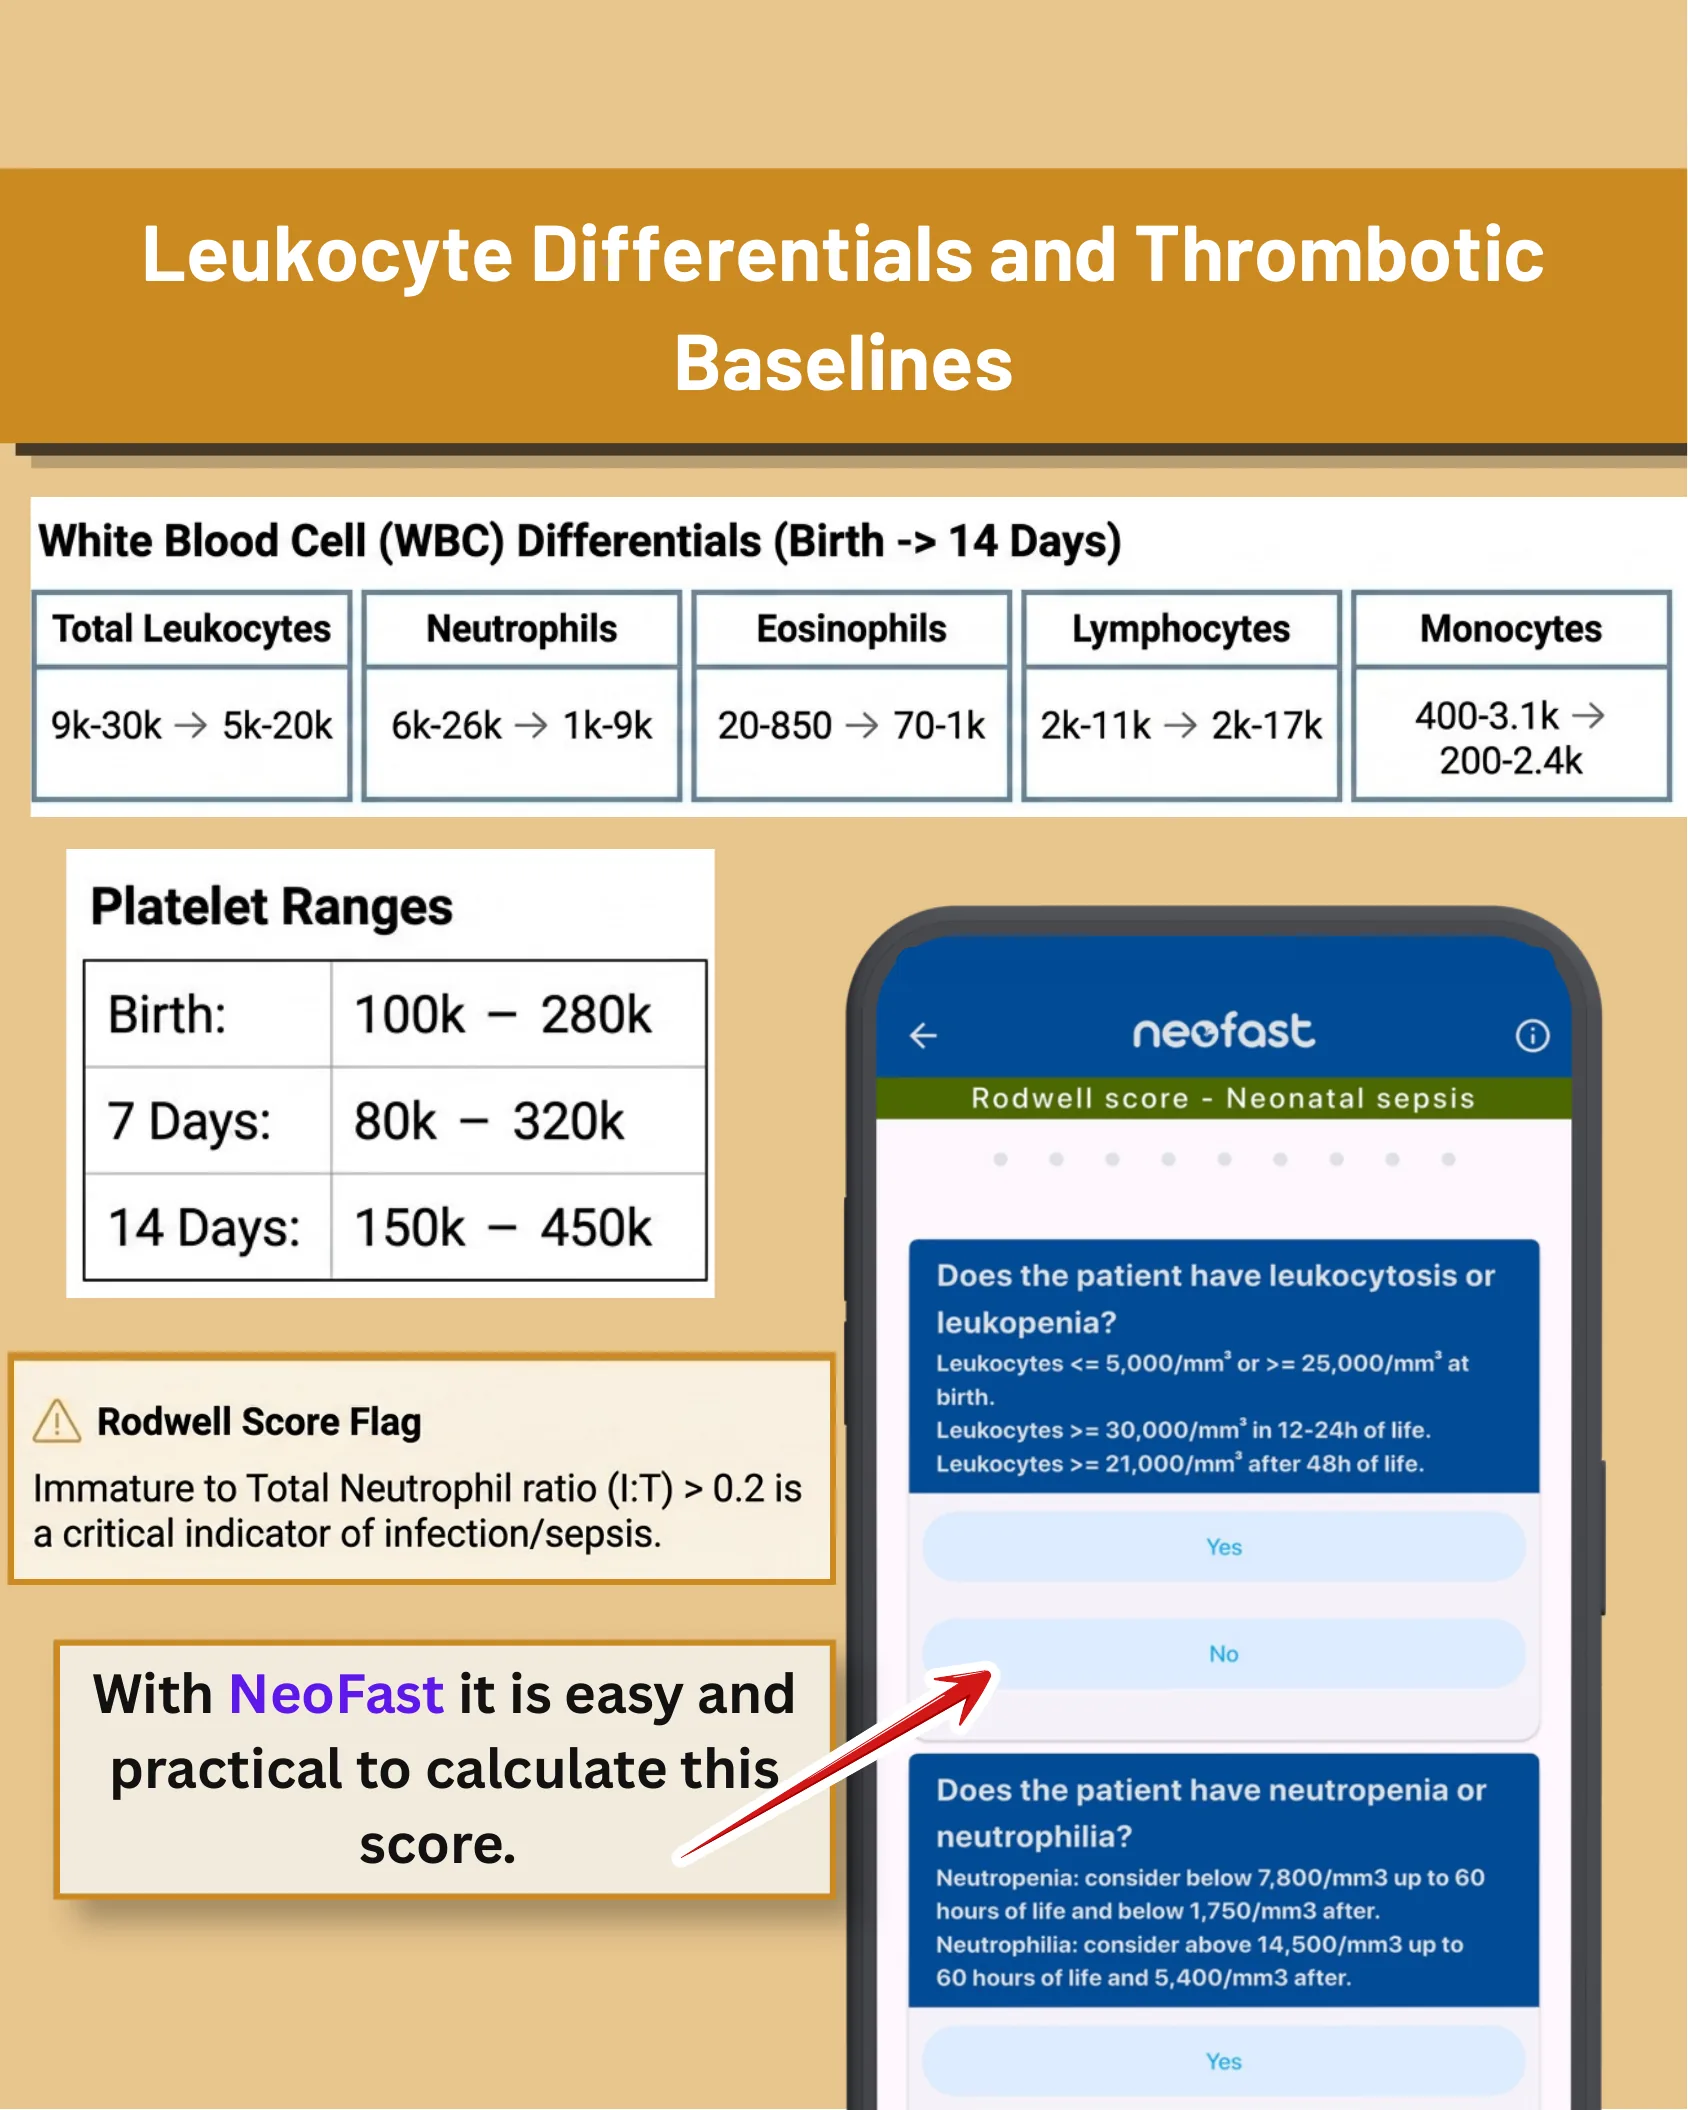
White Blood Cell (WBC) Differentials (Birth → 14 Days)
| Total Leukocytes | Neutrophils | Eosinophils | Lymphocytes | Monocytes |
|---|---|---|---|---|
| 9k-30k → 5k-20k | 6k-26k → 1k-9k | 20-850 → 70-1k | 2k-11k → 2k-17k | 400-3.1k → 200-2.4k |
Platelet Ranges
| Age | Range |
|---|---|
| Birth | 100k – 280k |
| 7 Days | 80k – 320k |
| 14 Days | 150k – 450k |
Rodwell Score Flag: Immature to Total Neutrophil ratio (I:T) > 0.2 is a critical indicator of infection/sepsis.
With NeoFast it is easy and practical to calculate this score.
- Does the patient have leukocytosis or leukopenia? Leukocytes <= 5,000/mm³ or >= 25,000/mm³ at birth. Leukocytes >= 30,000/mm³ in 12-24h of life. Leukocytes >= 21,000/mm³ after 48h of life.
- Does the patient have neutropenia or neutrophilia? Neutropenia: consider below 7,800/mm3 up to 60 hours of life and below 1,750/mm3 after. Neutrophilia: consider above 14,500/mm3 up to 60 hours of life and 5,400/mm3 after.
Hemostasis Development and the Coagulation Cascade
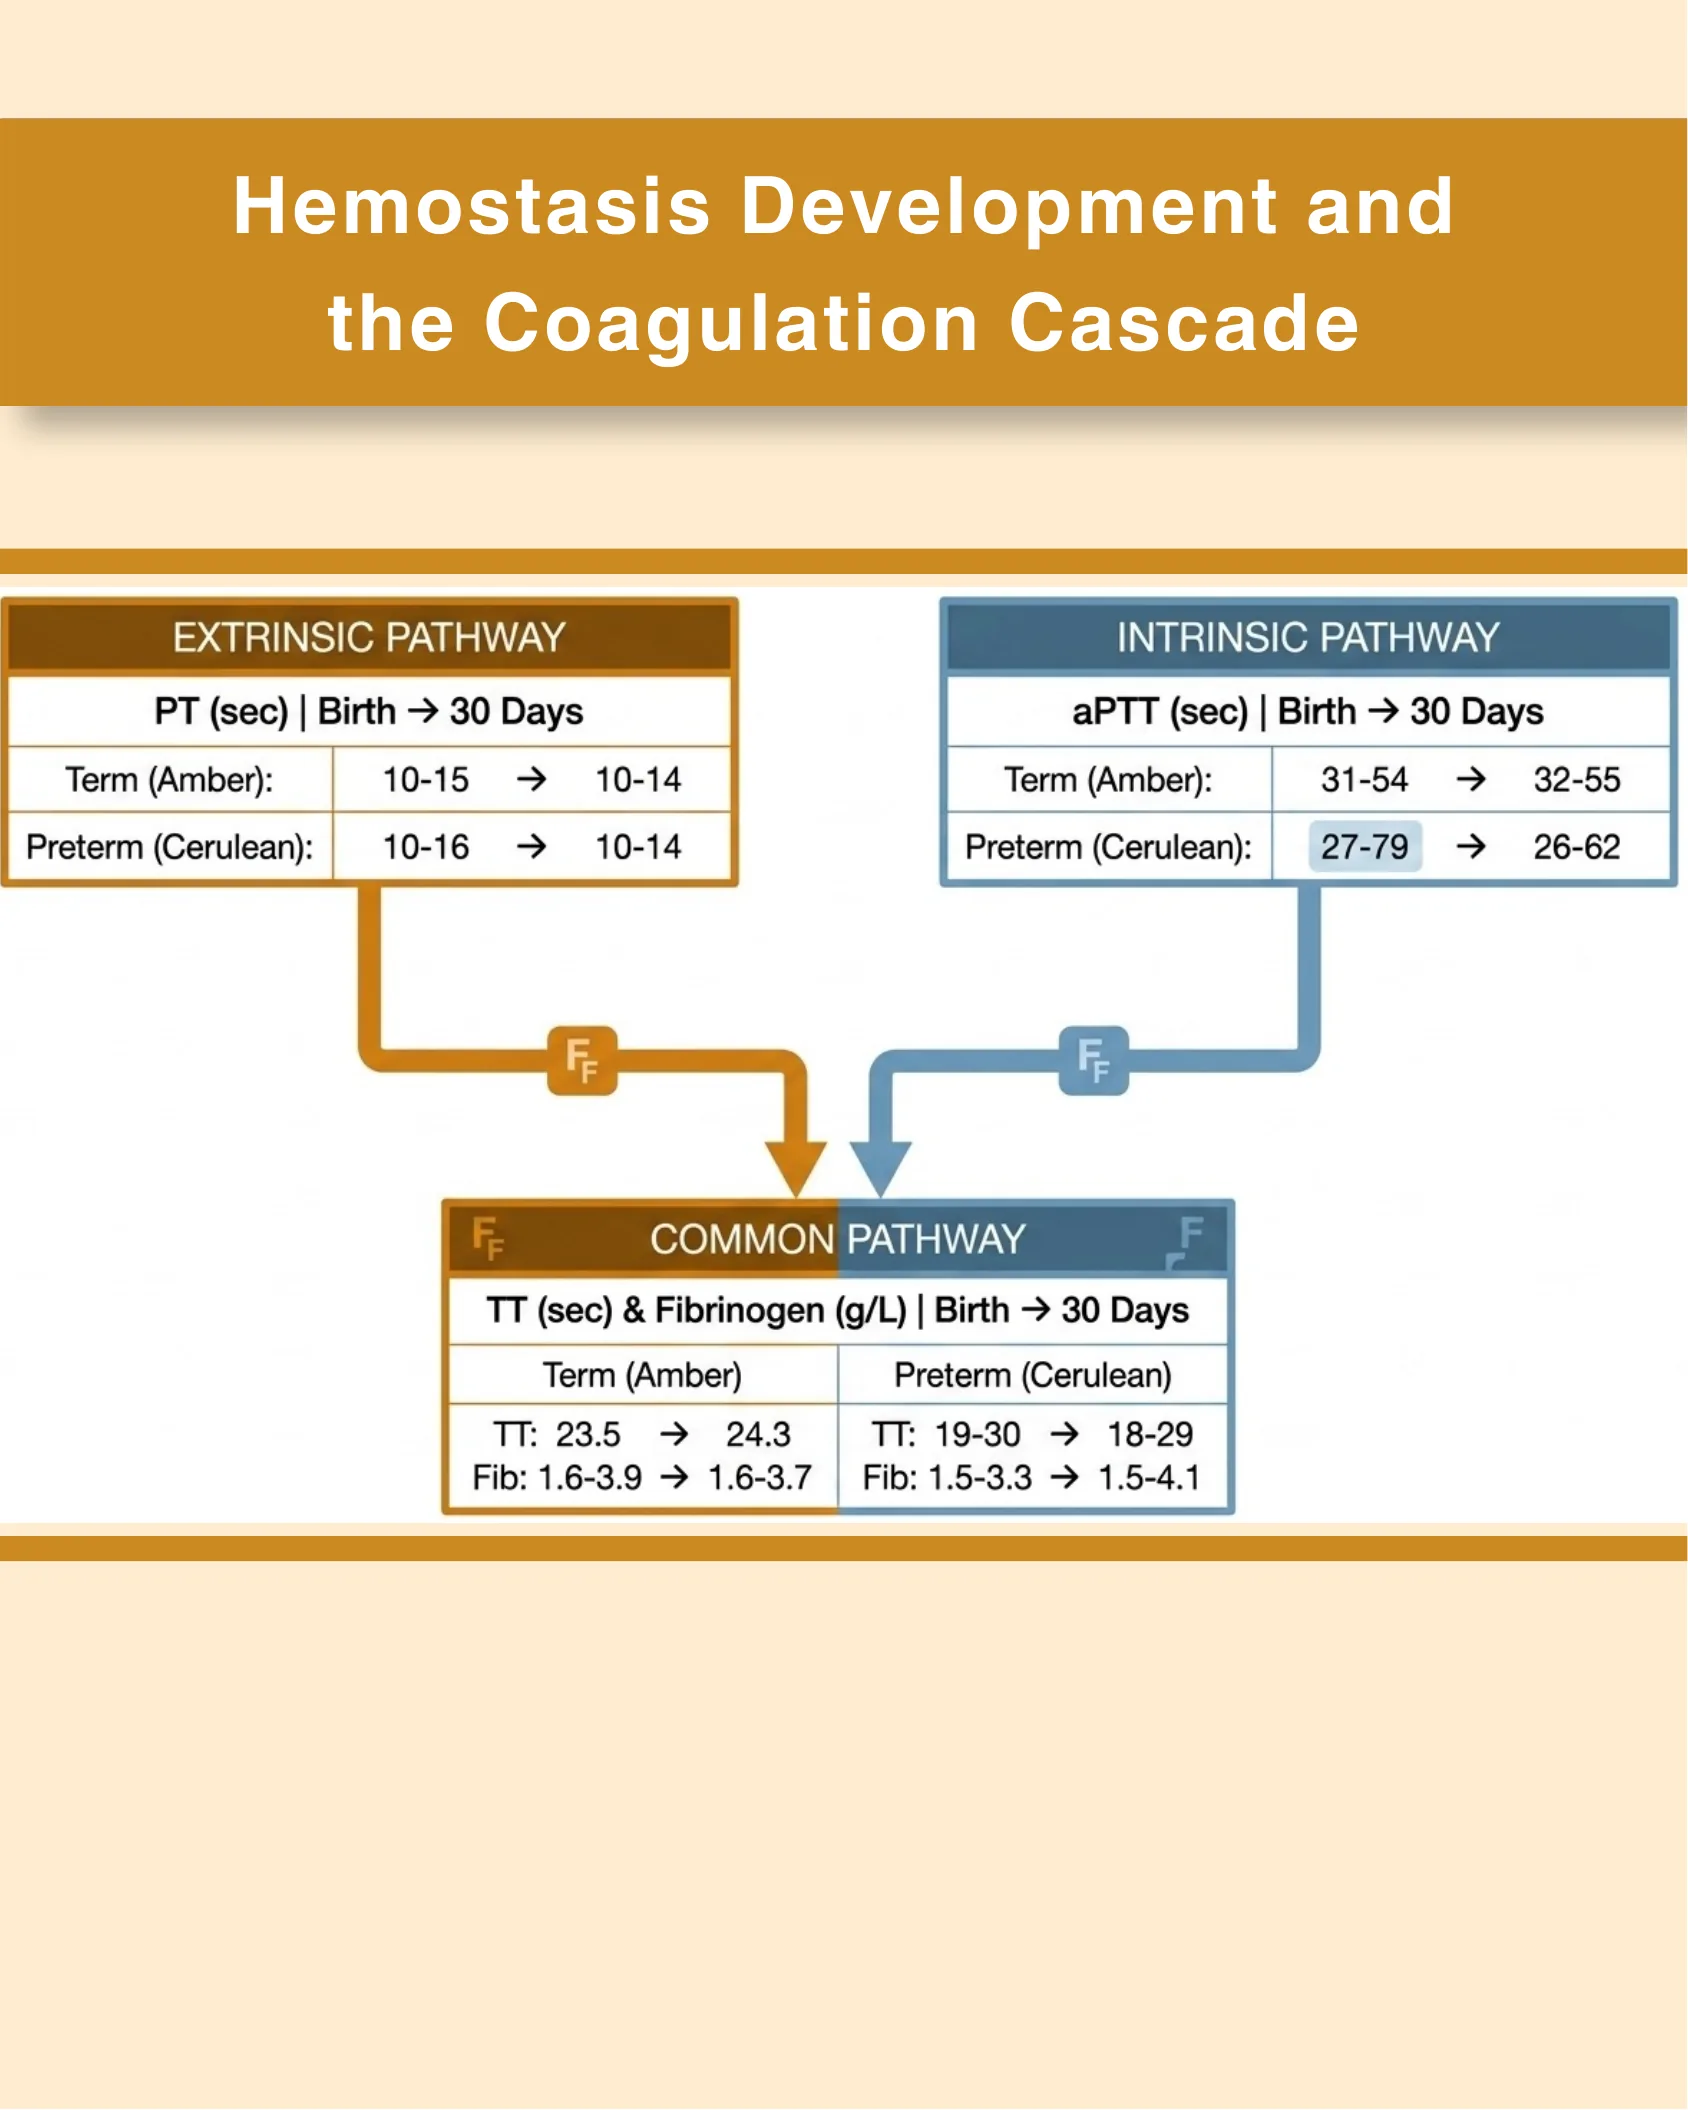
Extrinsic Pathway
PT (sec) | Birth → 30 Days
| Group | Birth | 30 Days |
|---|---|---|
| Term (Amber) | 10-15 | 10-14 |
| Preterm (Cerulean) | 10-16 | 10-14 |
Intrinsic Pathway
aPTT (sec) | Birth → 30 Days
| Group | Birth | 30 Days |
|---|---|---|
| Term (Amber) | 31-54 | 32-55 |
| Preterm (Cerulean) | 27-79 | 26-62 |
Common Pathway
TT (sec) & Fibrinogen (g/L) | Birth → 30 Days
| Group | TT | Fibrinogen |
|---|---|---|
| Term (Amber) | 23.5 → 24.3 | 1.6-3.9 → 1.6-3.7 |
| Preterm (Cerulean) | 19-30 → 18-29 | 1.5-3.3 → 1.5-4.1 |
Renal Maturation and Electrolyte Stabilization
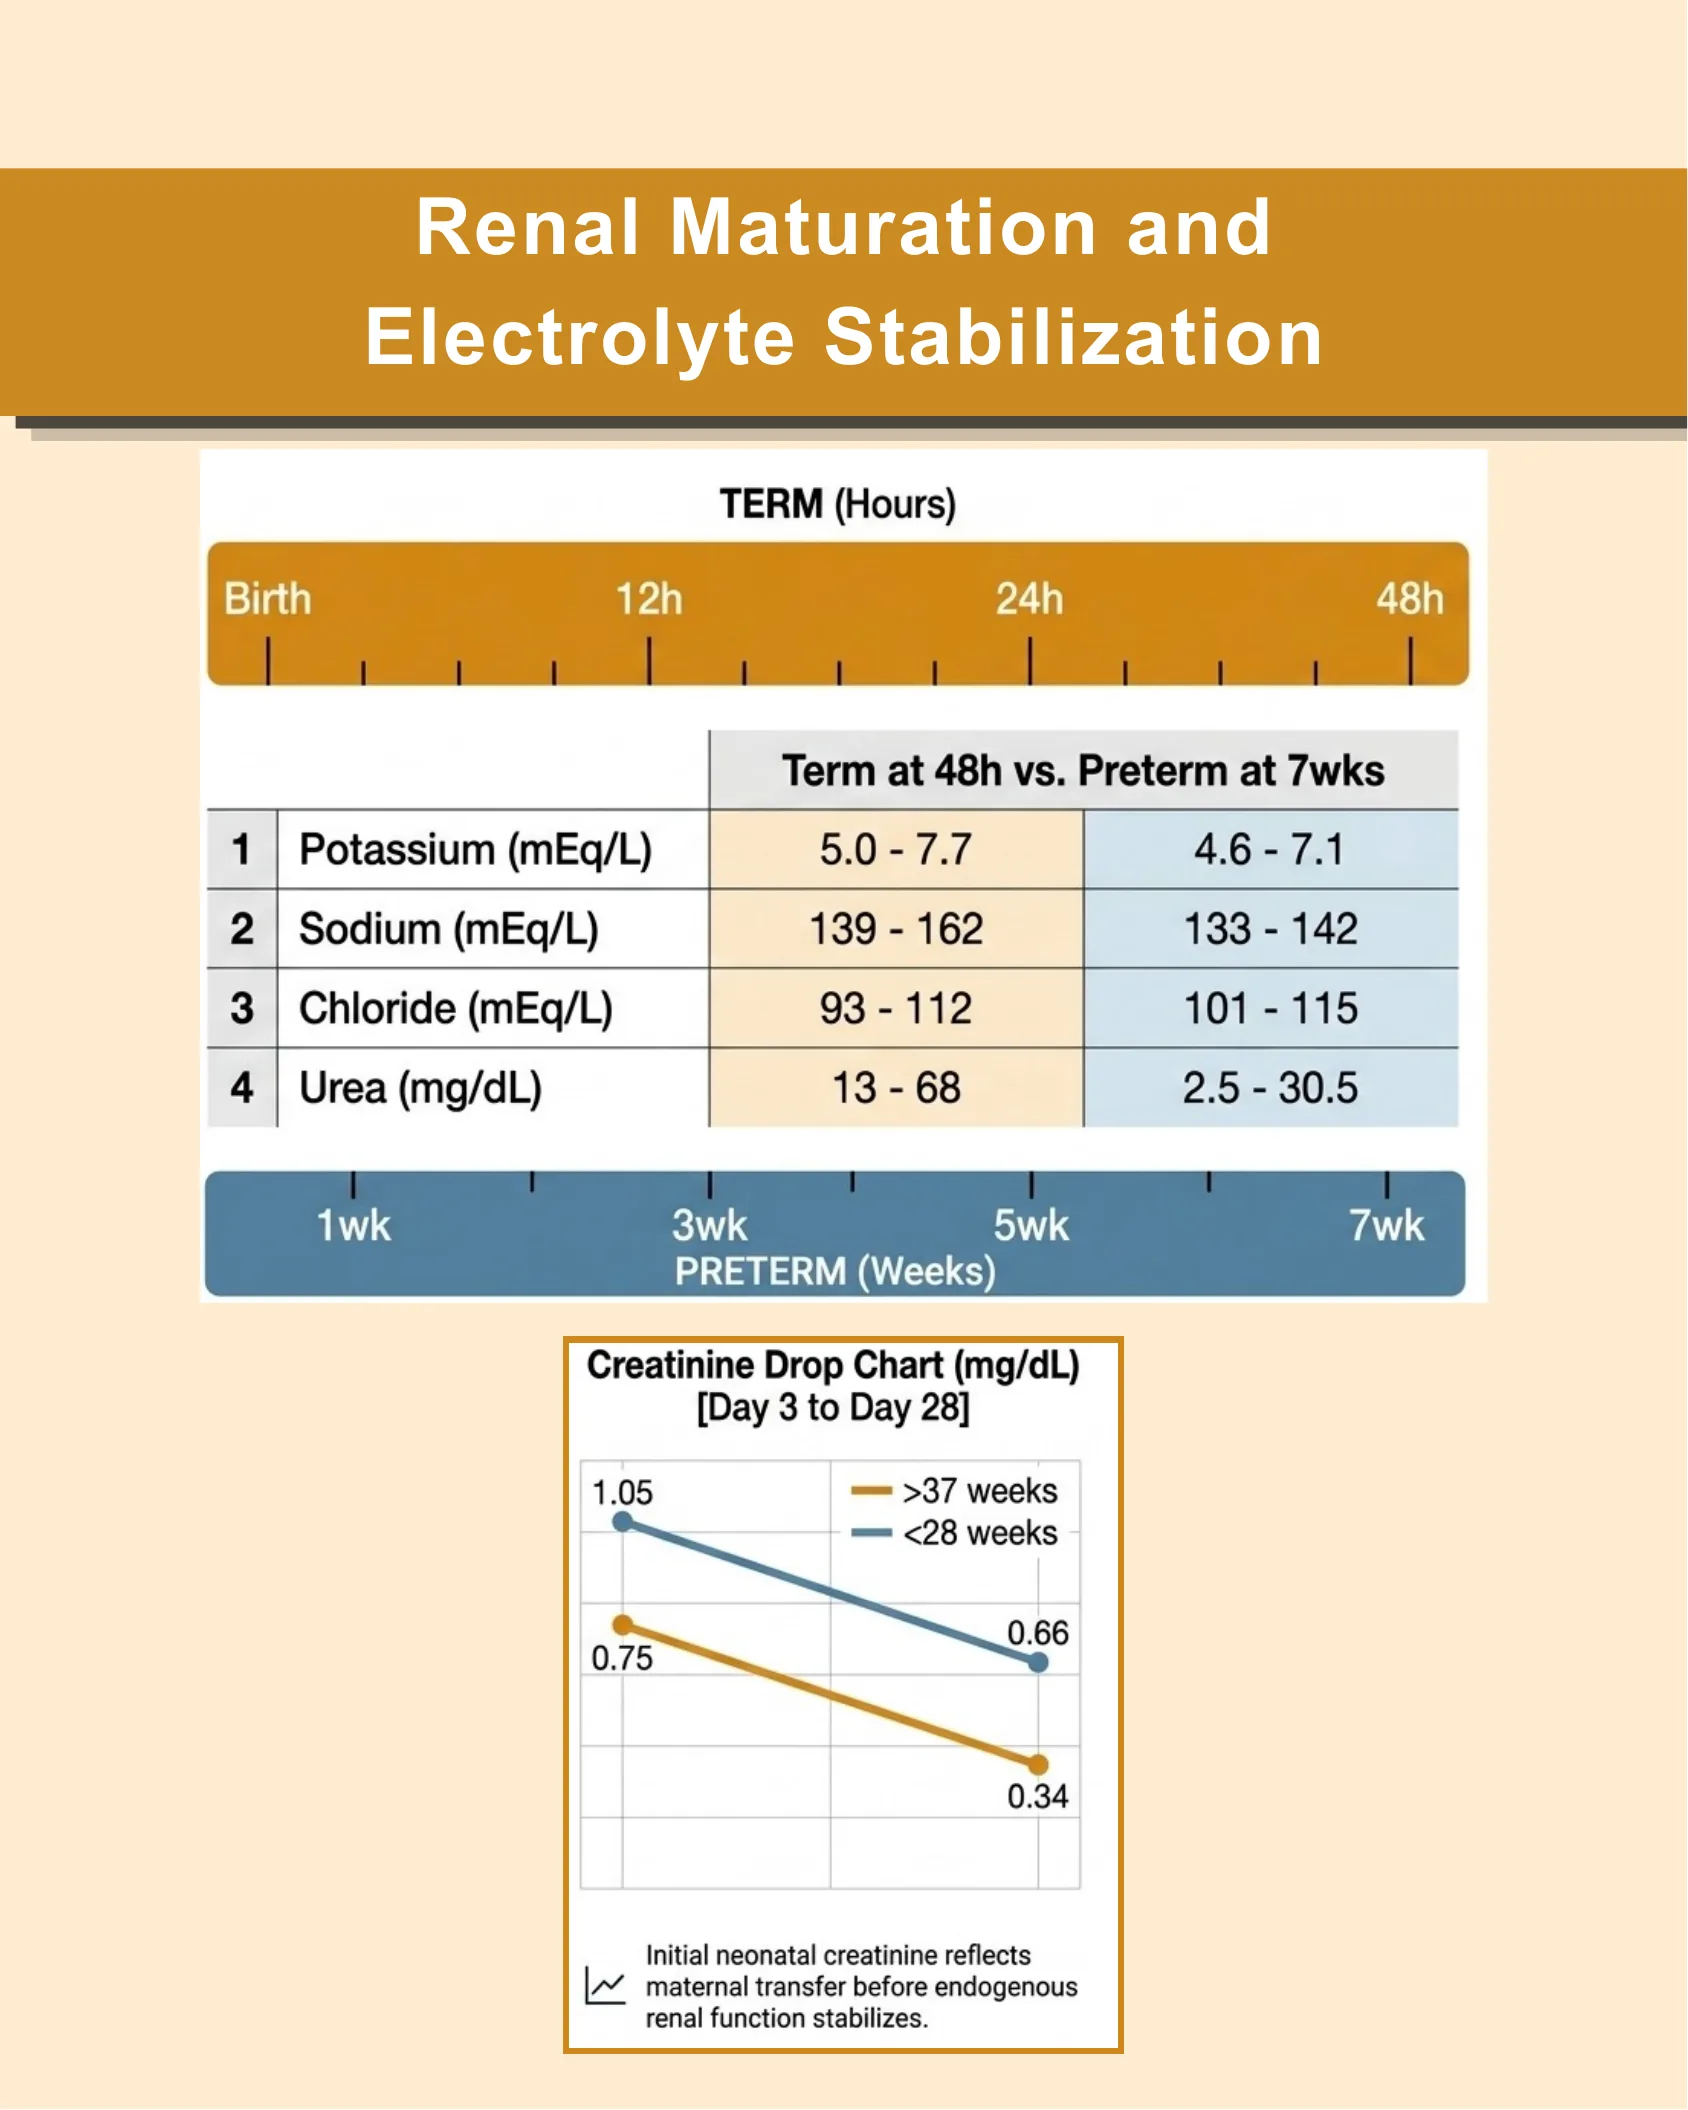
Term at 48h vs. Preterm at 7wks
| # | Parameter | Term at 48h | Preterm at 7wks |
|---|---|---|---|
| 1 | Potassium (mEq/L) | 5.0 – 7.7 | 4.6 – 7.1 |
| 2 | Sodium (mEq/L) | 139 – 162 | 133 – 142 |
| 3 | Chloride (mEq/L) | 93 – 112 | 101 – 115 |
| 4 | Urea (mg/dL) | 13 – 68 | 2.5 – 30.5 |
Creatinine Drop Chart (mg/dL) [Day 3 to Day 28]
| Group | Day 3 | Day 28 |
|---|---|---|
| >37 weeks | 0.75 | 0.34 |
| <28 weeks | 1.05 | 0.66 |
Initial neonatal creatinine reflects maternal transfer before endogenous renal function stabilizes.
Energy Homeostasis and Bone Mineralization
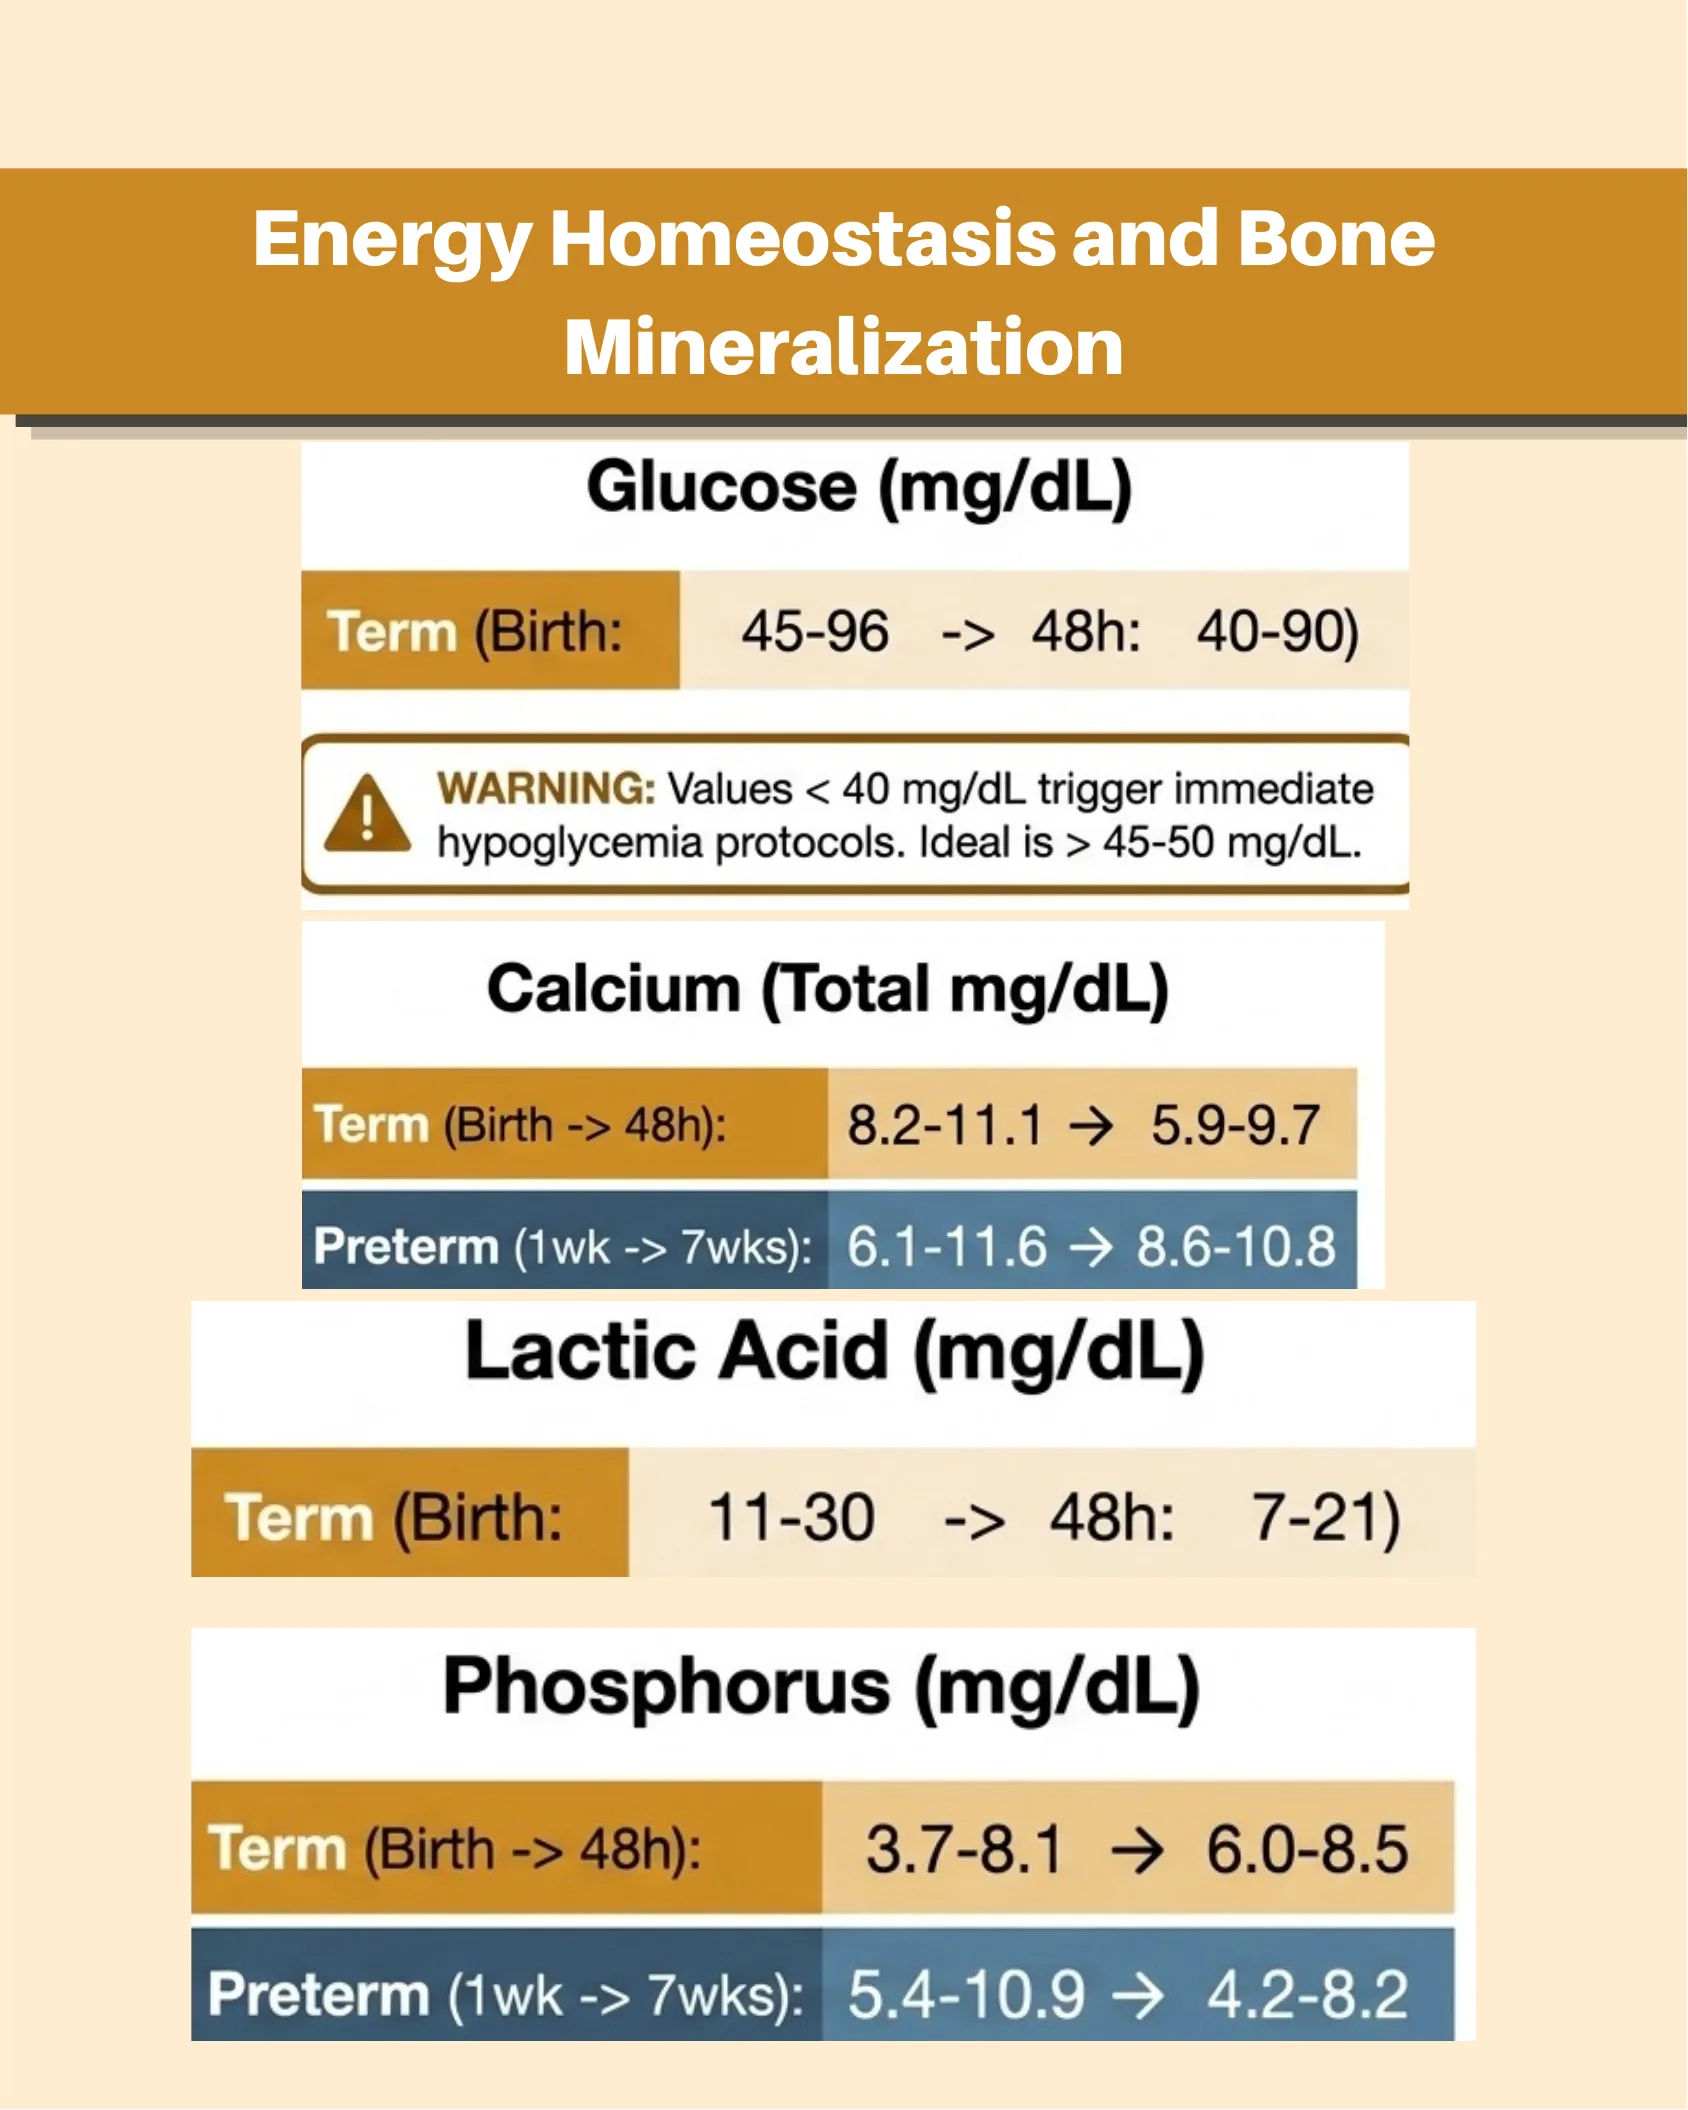
Glucose (mg/dL)
Term (Birth: 45-96 -> 48h: 40-90)
WARNING: Values < 40 mg/dL trigger immediate hypoglycemia protocols. Ideal is > 45-50 mg/dL.
Calcium (Total mg/dL)
| Group | Start | End |
|---|---|---|
| Term (Birth -> 48h) | 8.2-11.1 | 5.9-9.7 |
| Preterm (1wk -> 7wks) | 6.1-11.6 | 8.6-10.8 |
Lactic Acid (mg/dL)
Term (Birth: 11-30 -> 48h: 7-21)
Phosphorus (mg/dL)
| Group | Start | End |
|---|---|---|
| Term (Birth -> 48h) | 3.7-8.1 | 6.0-8.5 |
| Preterm (1wk -> 7wks) | 5.4-10.9 | 4.2-8.2 |
Hepatic Synthesis and Clearance Profiles
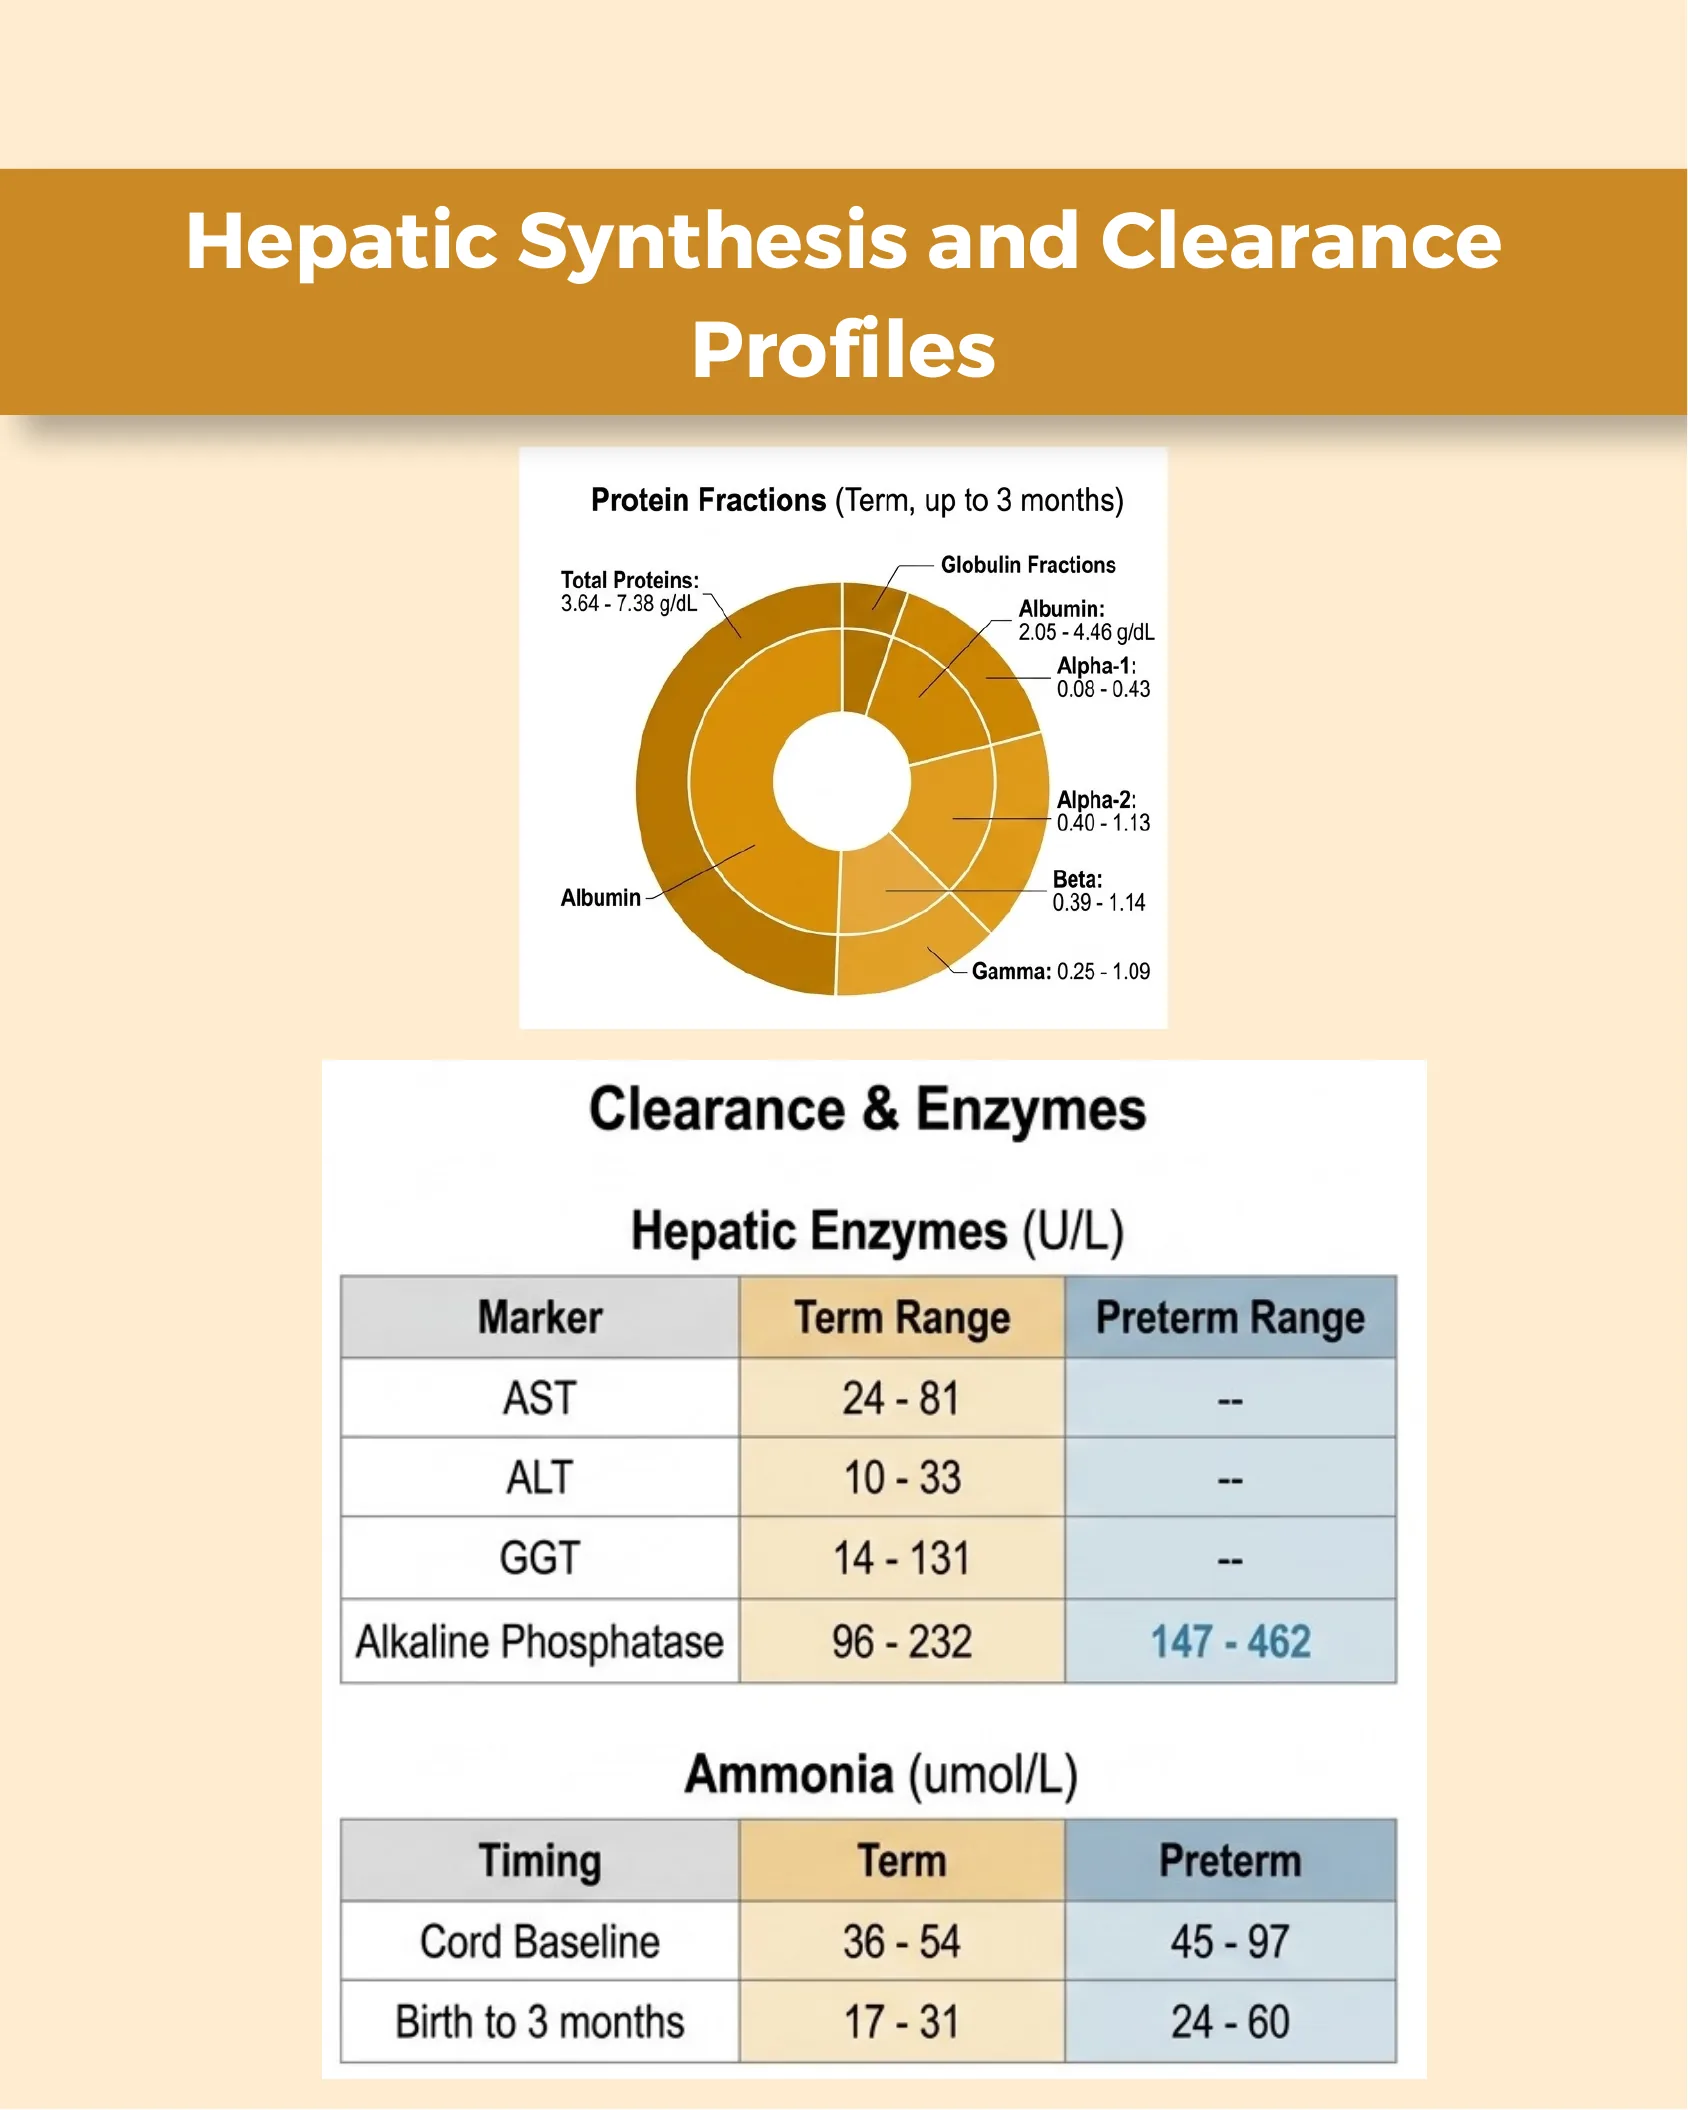
Protein Fractions (Term, up to 3 months)
- Total Proteins: 3.64 – 7.38 g/dL
- Albumin: 2.05 – 4.46 g/dL
- Alpha-1: 0.08 – 0.43
- Alpha-2: 0.40 – 1.13
- Beta: 0.39 – 1.14
- Gamma: 0.25 – 1.09
Clearance & Enzymes
Hepatic Enzymes (U/L)
| Marker | Term Range | Preterm Range |
|---|---|---|
| AST | 24 – 81 | — |
| ALT | 10 – 33 | — |
| GGT | 14 – 131 | — |
| Alkaline Phosphatase | 96 – 232 | 147 – 462 |
Ammonia (umol/L)
| Timing | Term | Preterm |
|---|---|---|
| Cord Baseline | 36 – 54 | 45 – 97 |
| Birth to 3 months | 17 – 31 | 24 – 60 |
Central Nervous System: Cerebrospinal Fluid (CSF) & Endocrine Adaptation: Thyroid Function
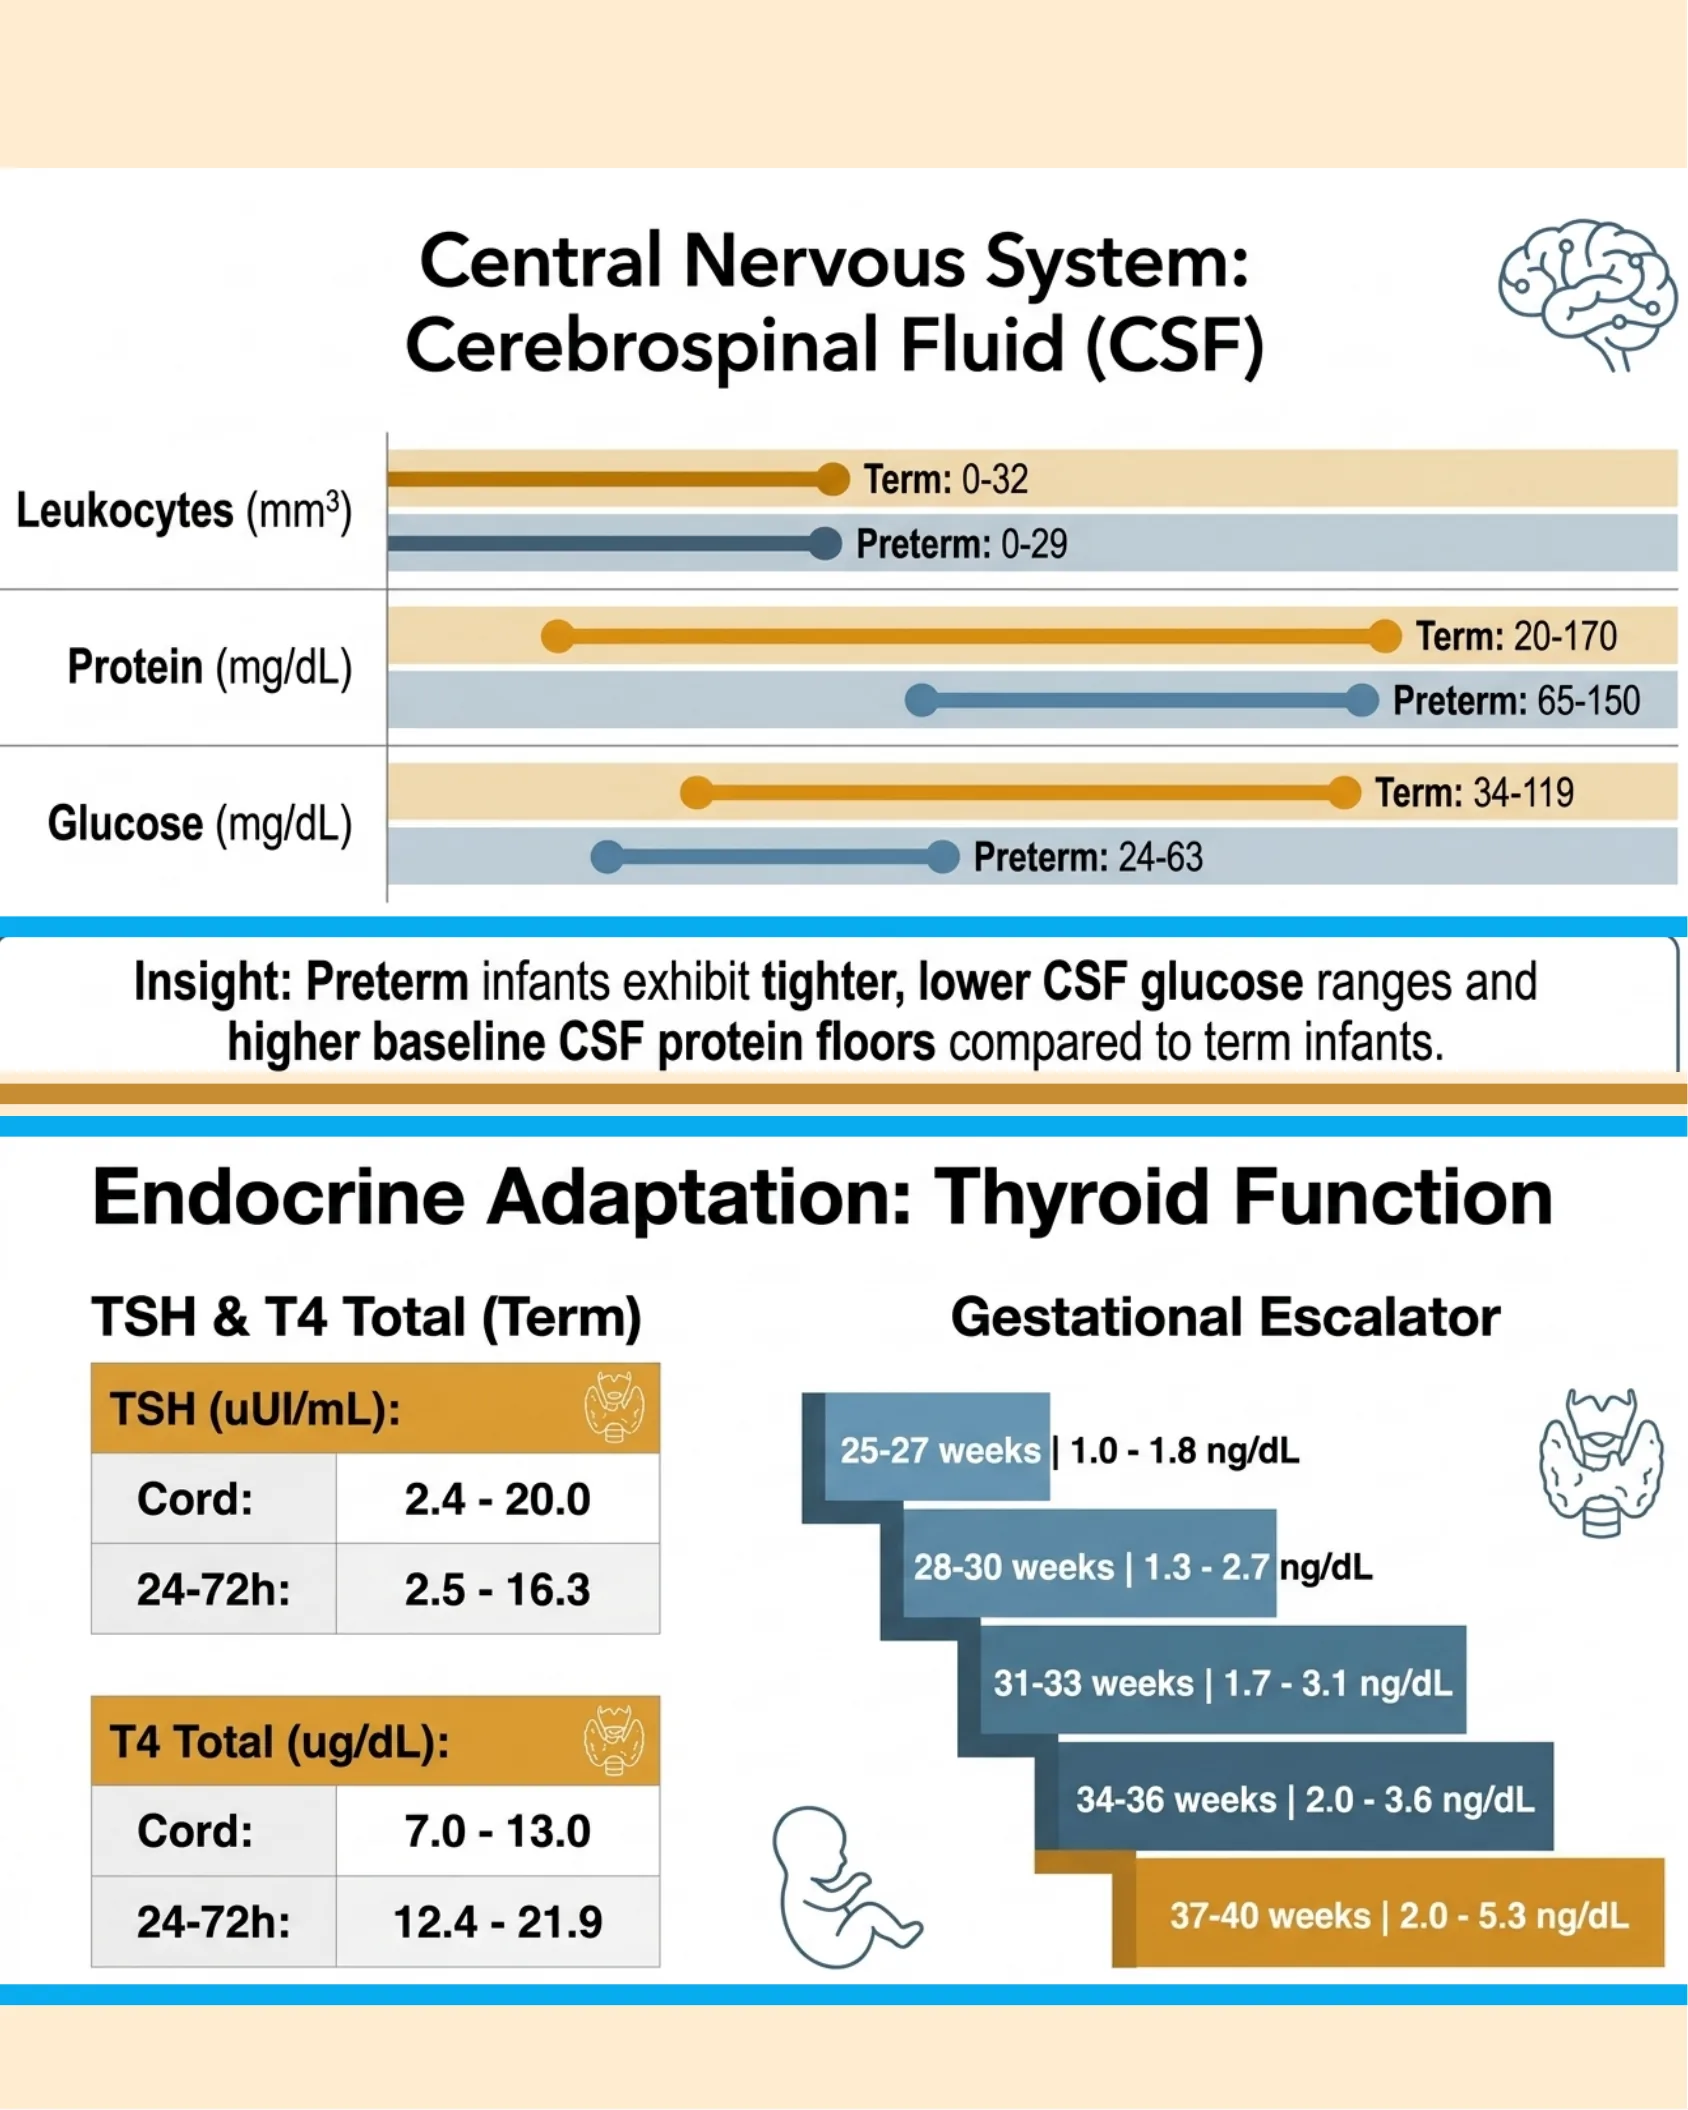
Central Nervous System: Cerebrospinal Fluid (CSF)
| Marker | Term Range | Preterm Range |
|---|---|---|
| Leukocytes (mm³) | 0-32 | 0-29 |
| Protein (mg/dL) | 20-170 | 65-150 |
| Glucose (mg/dL) | 34-119 | 24-63 |
Insight: Preterm infants exhibit tighter, lower CSF glucose ranges and higher baseline CSF protein floors compared to term infants.
Endocrine Adaptation: Thyroid Function
TSH & T4 Total (Term)
| TSH (uUI/mL) | Value |
|---|---|
| Cord | 2.4 – 20.0 |
| 24-72h | 2.5 – 16.3 |
| T4 Total (ug/dL) | Value |
|---|---|
| Cord | 7.0 – 13.0 |
| 24-72h | 12.4 – 21.9 |
Gestational Escalator
- 25-27 weeks | 1.0 – 1.8 ng/dL
- 28-30 weeks | 1.3 – 2.7 ng/dL
- 31-33 weeks | 1.7 – 3.1 ng/dL
- 34-36 weeks | 2.0 – 3.6 ng/dL
- 37-40 weeks | 2.0 – 5.3 ng/dL
The Preterm Divergence Map
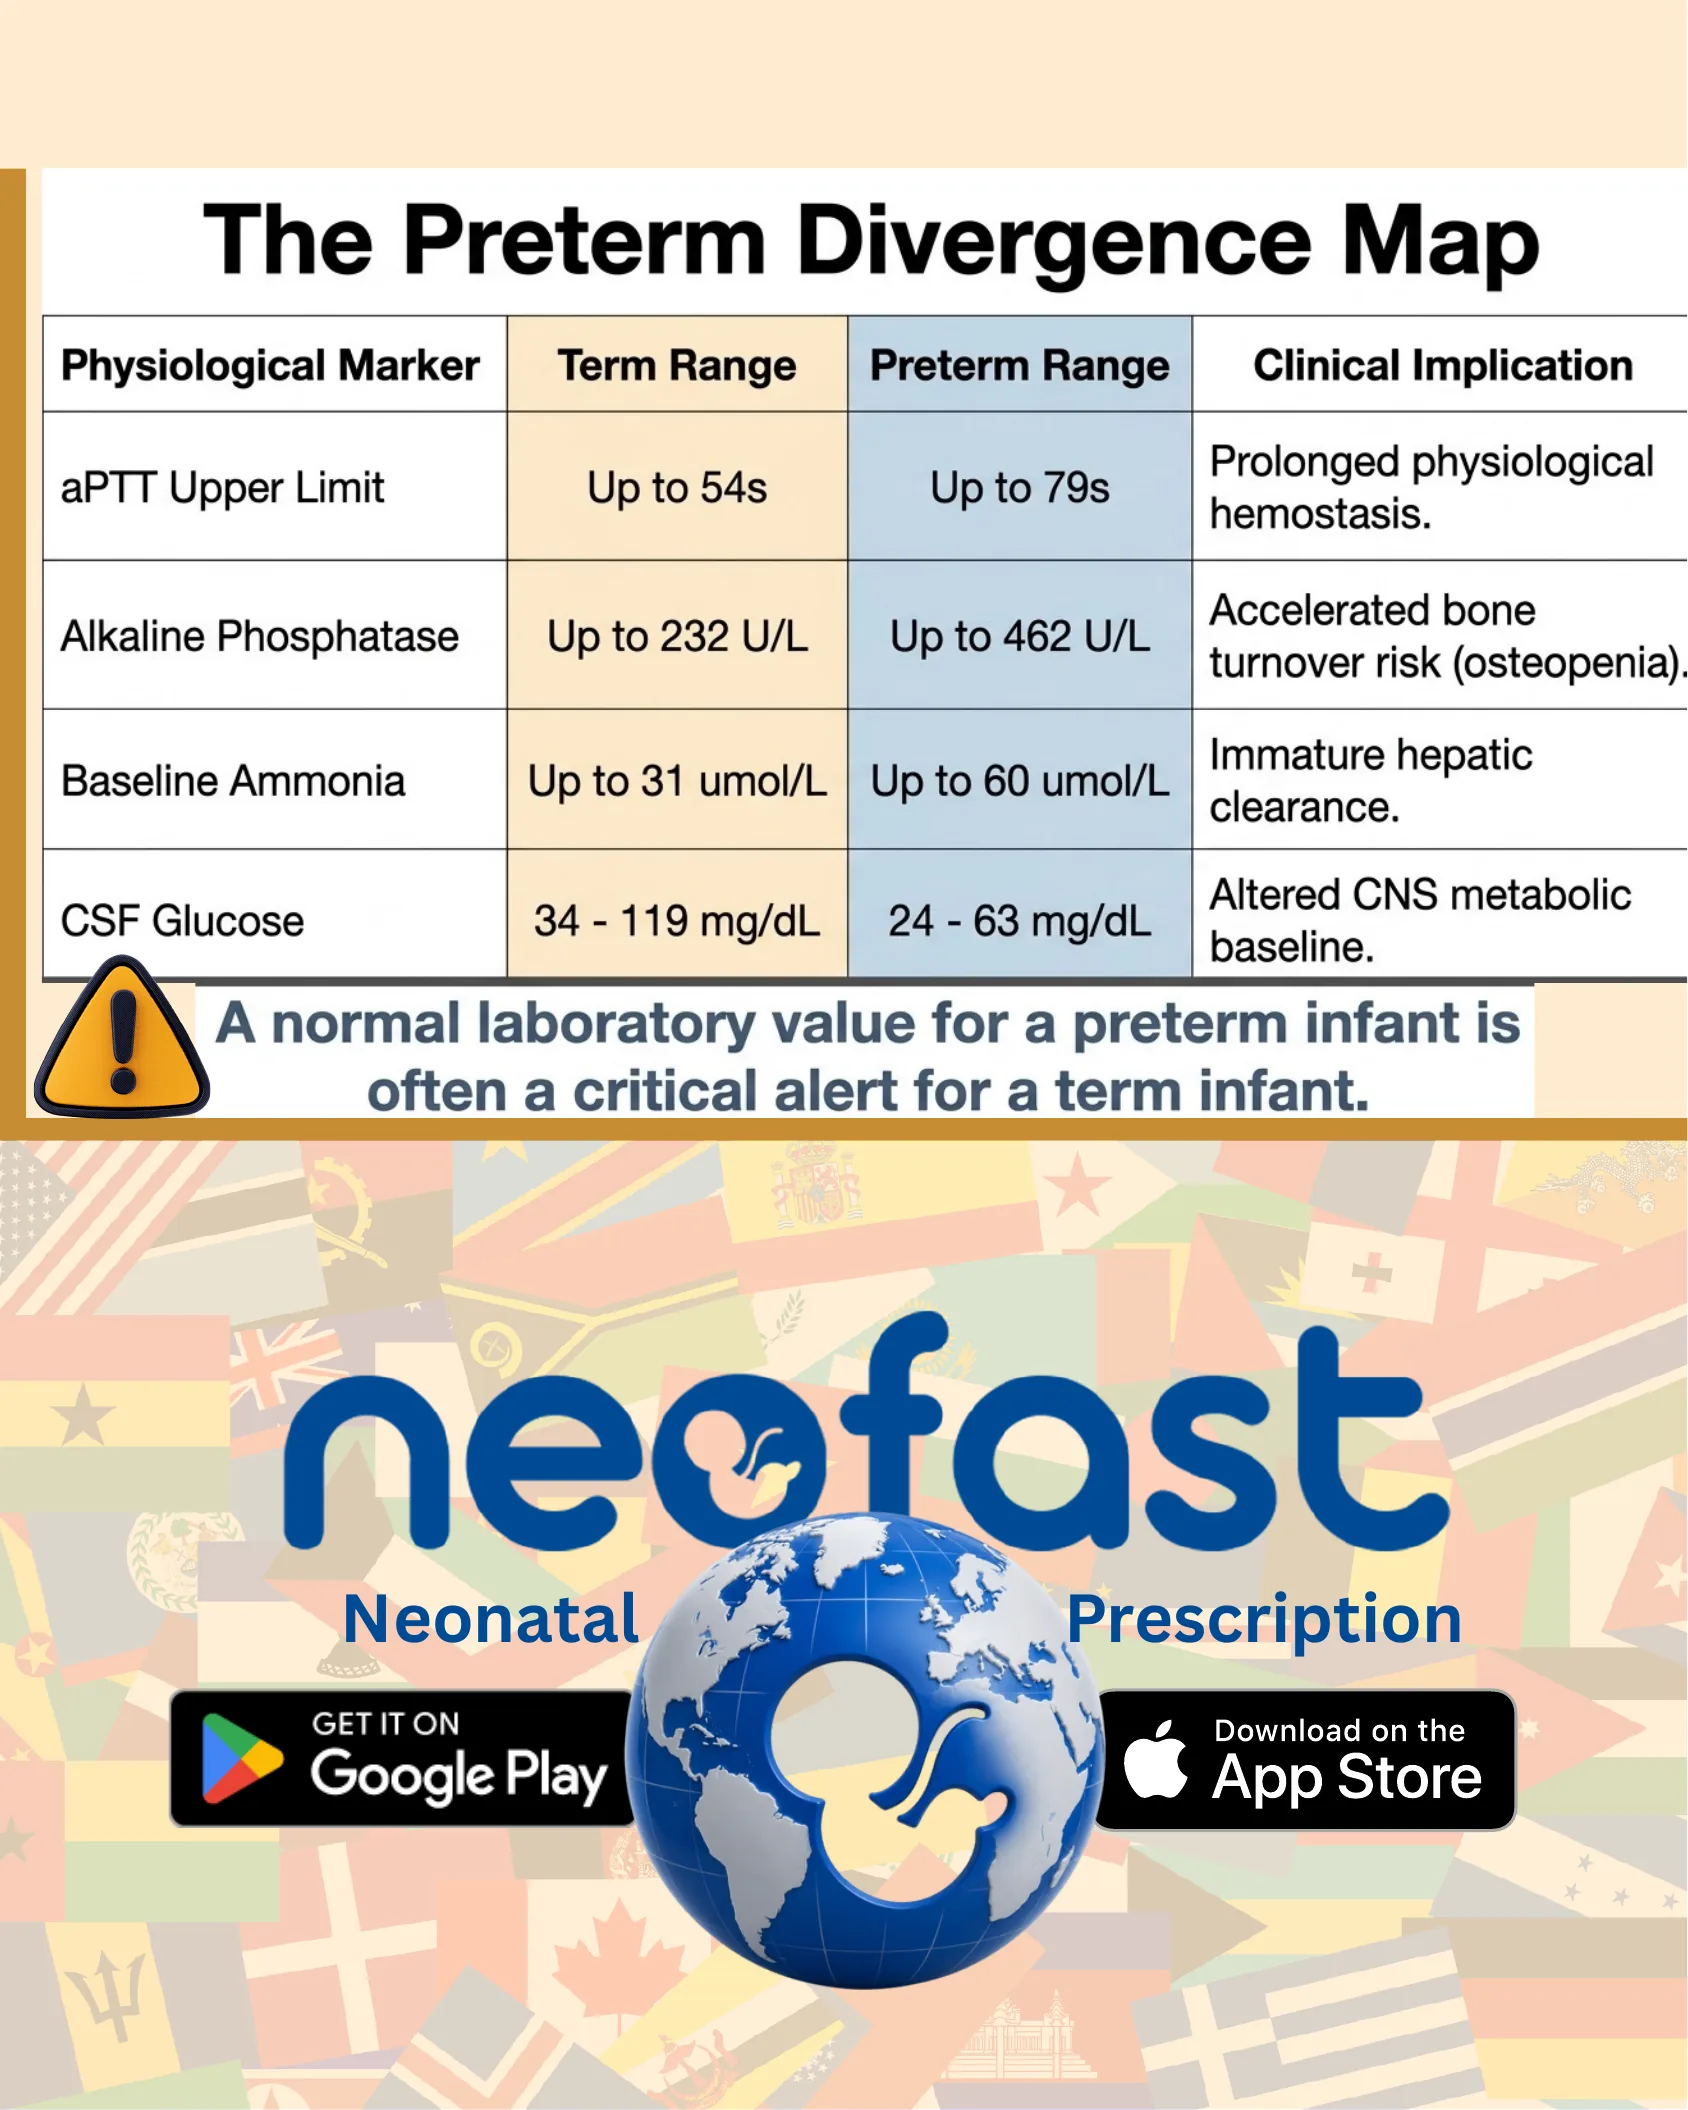
The Preterm Divergence Map
| Physiological Marker | Term Range | Preterm Range | Clinical Implication |
|---|---|---|---|
| aPTT Upper Limit | Up to 54s | Up to 79s | Prolonged physiological hemostasis. |
| Alkaline Phosphatase | Up to 232 U/L | Up to 462 U/L | Accelerated bone turnover risk (osteopenia). |
| Baseline Ammonia | Up to 31 umol/L | Up to 60 umol/L | Immature hepatic clearance. |
| CSF Glucose | 34 – 119 mg/dL | 24 – 63 mg/dL | Altered CNS metabolic baseline. |
A normal laboratory value for a preterm infant is often a critical alert for a term infant.
Neofast
Neonatal Prescription
- Get it on Google Play
- Download on the App Store
Frequently asked questions
Do neonatal lab reference ranges differ for preterm versus term infants?
Yes — they are distinct and dynamic; a normal value for a preterm infant can be a critical alert for a term infant.
What I:T neutrophil ratio suggests sepsis?
A Rodwell immature-to-total neutrophil ratio greater than 0.2 is a critical indicator of infection or sepsis.
What glucose level triggers hypoglycemia management?
A glucose below 40 mg/dL triggers immediate hypoglycemia protocols; the ideal is above 45–50 mg/dL.
What is the normal hemoglobin at birth for a term neonate?
15.4–23.4 g/dL at birth, falling to about 9.0–15.5 g/dL by one month (physiological anemia).
Why is alkaline phosphatase higher in preterm infants?
Because of accelerated bone turnover, with values up to 462 U/L (vs 232 U/L in term), signaling osteopenia risk.